
Market Breadth Shows Signs Of Life
MARKET ACTION NEAR 50% RETRACEMENT MAY BE TELLING
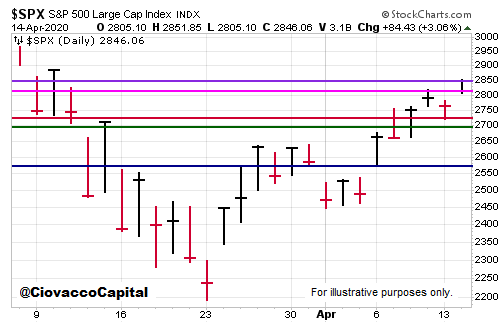
The S&P 500 closed Tuesday near the 50% retracement of the A to B decline shown in the chart below.
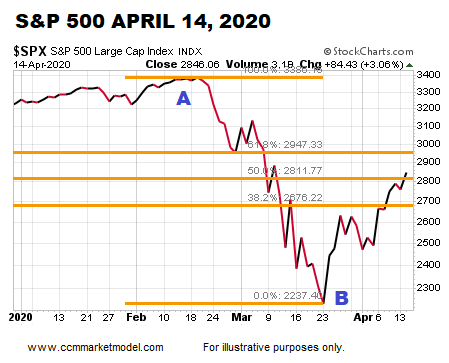
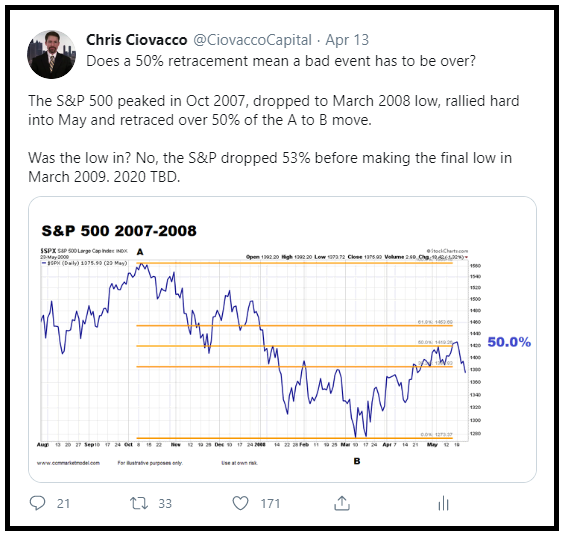
Something very similar happened after the initial drop from the major stock market highs made in March 2000 and October 2007. In each case, the market dropped a long way, had a very sharp rally, and moved back near the 50% retracement. In the 2000-01 case and 2007-08 cases, the S&P 500 reversed soon thereafter and resumed the bear market. The 2000-01 and 2007-08 cases are covered in detail in this thread of tweets. Therefore, it is prudent in 2020 to see how the market acts near a very similar 50% retracement level. Our current allocations reflect the forms of bullish improvement we have in hand and they reflect numerous forms of still-concerning evidence that we have in hand.
LONGER-TERM ODDS CONTINUE TO IMPROVE
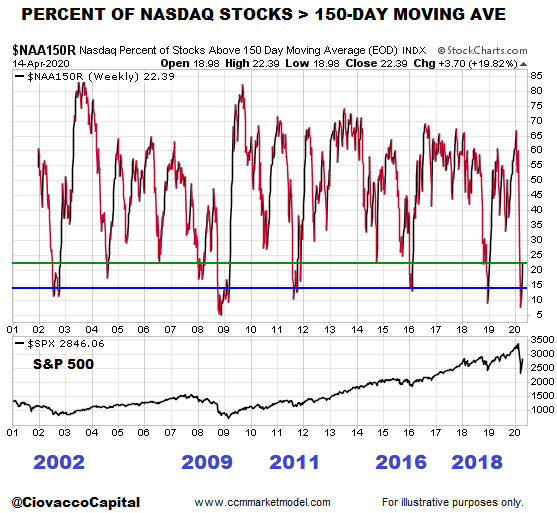
As shown in the chart below, it is relatively rare for the percent of NASDAQ stocks above their 150-day moving average to move from the blue line to the green line. The blue line represents a rare oversold level and a move back to the green line can be thought of as a breath thrust setup. Breadth thrusts typically occur when market participants are becoming more constructive on the long-term outlook for stocks and the economy. Notice how past oversold readings have occurred near favorable long-term risk-reward levels for the S&P 500 (bottom of chart).
The table below shows the S&P 500 performance after similar breath thrust setups in the percent of NASDAQ stocks greater than their 150-day moving average. The data below, based on something that occurred over the past 15 trading days, helps us keep an open mind about much better than expected long-term outcomes in the stock market. If you know market history, 2002, 2009, 2011, 2016, and 2018 all fall into the “major low” category. 2020 is a unique case and will follow a unique path.
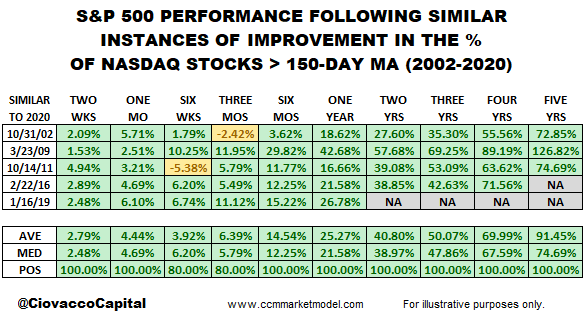
The study above is based on a setup. Setups require follow-through; something that may or may not happen in 2020. It is very important to understand what setup means. A setup tells us to pay attention and look for further confirmation signals. If the confirmation signals do not materialize, we will learn something in that case as well.
HISTORY SAYS PULLBACK WOULD NOT BE SHOCKING
Is it possible the stock market continues to rise and never looks back? Yes, it is possible based on the 2016 and 2019 cases shown in the table below. On April 14, 2020, the percent of NASDAQ stocks that had recaptured their 150-day moving average stood at 22.39%. In the five historical cases, how much backtracking occurred in the S&P 500 from dates shown below associated with similar moves in market breadth? The maximum drawdown was 9.60%. The median drawdown was 4.30% and the average drawdown was 4.11%.

If a similar giveback occurred in the next six months, what would that hypothetically look like on a chart of the S&P 500? The answer is shown below.
BREADTH TODAY VS. 2018-2019 THRUST
As of this writing, 2020 market breadth has not demonstrated the same extremely confident shift that occurred in early 2019. Thus far, the breadth signals are more muted, but we have seen enough to respect the historical message in similar shifts. This week’s video opened with another bullish-leaning occurrence related to 2020 market breadth. The video also covered impressive moves in market breadth that occurred in bear markets and before the market’s final low was in place.
SOME MEASURES STILL LOOKING FOR IMPROVEMENT
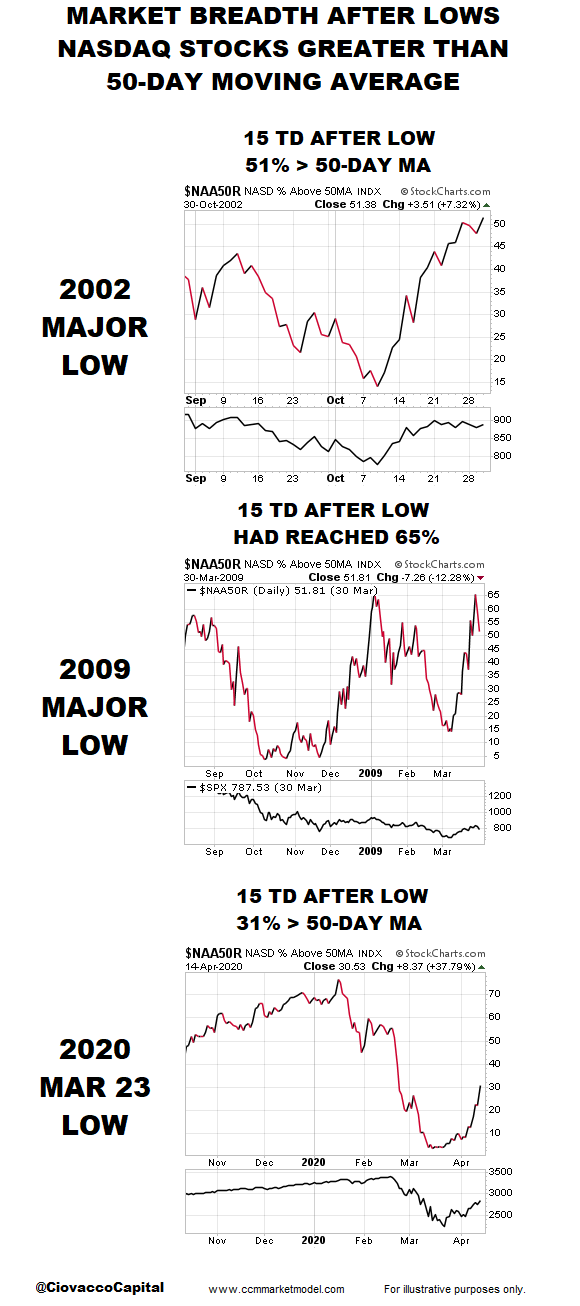
There are numerous ways to measure and track stock market breadth. Many breadth readings in 2020 still have some room for improvement. For example, April 14 was 15 trading days from the March 23, 2020 low in the S&P 500. The percentage of NASDAQ stocks above their 50-day moving average reached 51% in the first 15 trading days after the major low in 2002; after the 2009 low, the 15-trading day peak was roughly 65%. Thus far, the max 15-trading-day level in 2020 is quite a bit lower at 31%. Like many breadth indicators tracked by the CCM Market Model, we can learn something about bull/bear odds by monitoring the percentage of NASDAQ stocks > 50-day moving average in the coming days and weeks.
NO PREDICTIONS, NO FORECASTING
Not much has changed this week in terms of having a mixed hard data picture; some really good things have happened, and some concerning data points and observable evidence tell us the market has not shifted into a fully-accepting risk-on stance. For example, banks, junk bonds, transportation stocks, and small caps have continued to walk forward in a somewhat tepid manner. Therefore, the four market scenarios below continue to provide a framework for prudent contingency planning:
-
ONE: Low is in and stocks continue to rise rapidly.
-
TWO: The market will remain in a wide trading range.
-
THREE: A typical retest of the March 23 low is coming soon.
-
FOUR: An atypical retest with a significantly lower low lies ahead.
Unless you believe you can predict the future with 100% certainty (something we all know is not possible), it is prudent to have a mixed allocation currently that allows you a migration path to handle all four scenarios. Allocation shifts we have made in recent weeks reflect improving bullish odds and decreasing bearish odds based on data today relative to data 15 trading days ago.
Given the shifts in market breadth (constructive) and bearish reversals near the 50% retracements in 2001/2008, we will continue to see how the 2020 data evolves while remaining open to and prepared for a wide range of outcomes. Additional forms of positive and concerning evidence can be found on the CCM Twitter Feed.


