
Managing Expectations: US Equity Factor Correlations - Tuesday, Oct. 8
What are you expecting from equity factor ETFs? A number of research studies over the years encourage multi-factor exposure for enhance risk-adjusted return for a US equity allocation. At the core of this recommendation is the idea that different factors exhibit low correlation to one another. Value moves to the beat of its own drummer vis-à-vis momentum, which is relatively independent of the low-volatility factor, and so on.
The question is how this assumption holds up in practice? For some insight, let’s review how a set of exchange-traded funds stack up. The ETFs below represent various US equity factors and so by analyzing the group we can develop some real-world perspective for managing expectations.
As a preview, the results suggest that while there’s a modest degree of diversification benefits for some equity factor pairs, the broad market beta still dominates in most cases. The message, which isn’t surprising: equity portfolios are still equity portfolios. Short of going to more extreme choices (long-short strategies, for instance), it’s difficult to escape the stock market beta’s gravitational pull through a factor lens.
That’s not to say that diversifying across equity factors is worthless. Au contraire! But you can’t get blood out of a stone and so it’s essential that your expectations on what’s possible line up with real-world experience.
With that in mind, let’s dive into the numbers. The first order of business is noting that the correlation analytics below are based on risk premia – subtracting a “risk-free” rate from the ETF returns. As a proxy for the risk-free return we’ll use iShares Short Treasury Bond (SHV).
For the factor proxies, here’s the opportunity set we’ll review:
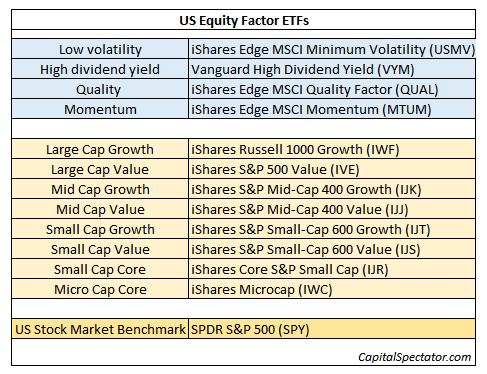
For the first cut, consider how correlations line up for daily returns for the trailing one-year period through yesterday’s close (Oct. 7). The lowest correlations (i.e., the biggest bang for your buck re: diversification benefit) are found with minimum volatility (USMV) and micro-cap shares (IWC) via a 0.69 correlation. That’s fairly low and it implies that there’s a substantial amount of independence between the two factors. Not too shabby when you consider that the results still reflect a relationship within the US equity sphere. (Note: correlations range from +1.0, which is perfect positive correlation, to 0.0 or no correlation, and -1.0 perfect negative correlation.)
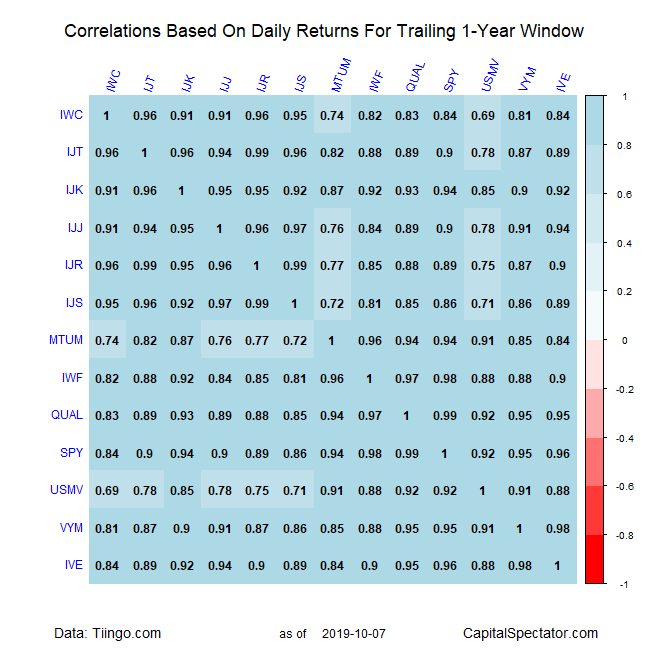
Alas, most of the correlations are moderately higher, with the bulk of results north of 0.80. That’s a reminder that the diversification benefits for most equity factor premia (at least for the ETFs listed above) are limited. That’s certainly true when we compare the factor ETFs to the broad market via SPDR S&P 500 (SPY). Note that all the factor ETFs exhibit correlations with SPY that range from 0.84 to 0.99. In other words, breaking free of the main US equity beta is challenging.
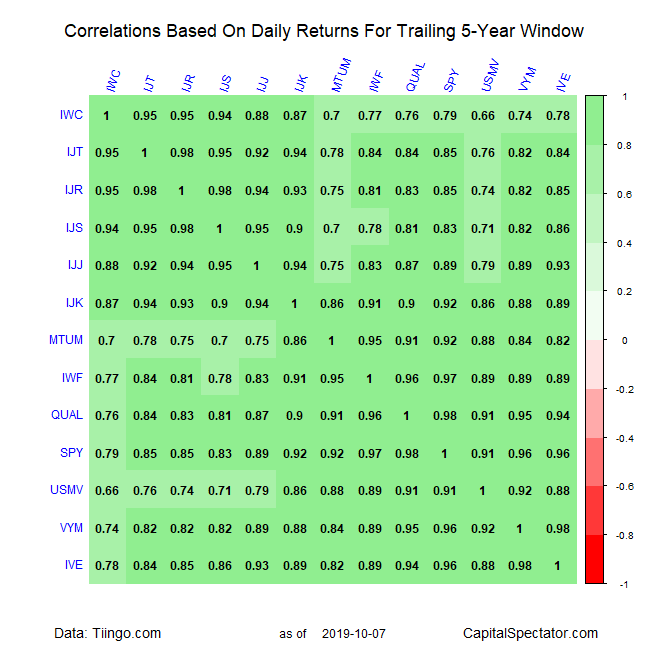
Then again, looking at the past one-year window may be misleading. Let’s expand the trailing period for daily risk premia to a five-year period look-back. Does that improve the diversification profile? Yes, albeit modestly. For example, the correlation between micro-cap shares (IWC) and the broad market (SPY) ticks down to 0.79 for the five-year window — a bit below the 0.84 reading for the trailing one-year period.
For purposes of portfolio design, however, it’s reasonable to focus on returns longer than daily results. Rolling one-year performances, for instance, may be more relevant for assessing risk premia relationships for asset allocation. On that point, the results in the table below are more encouraging — i.e., correlations tend to be modestly lower. The lowest pairings are found with low volatility (USMV)/small-cap growth (IJT) and low vol (USMV)/micro caps (IWC). On both counts, the correlations are 0.31 for one-year returns since 2014.
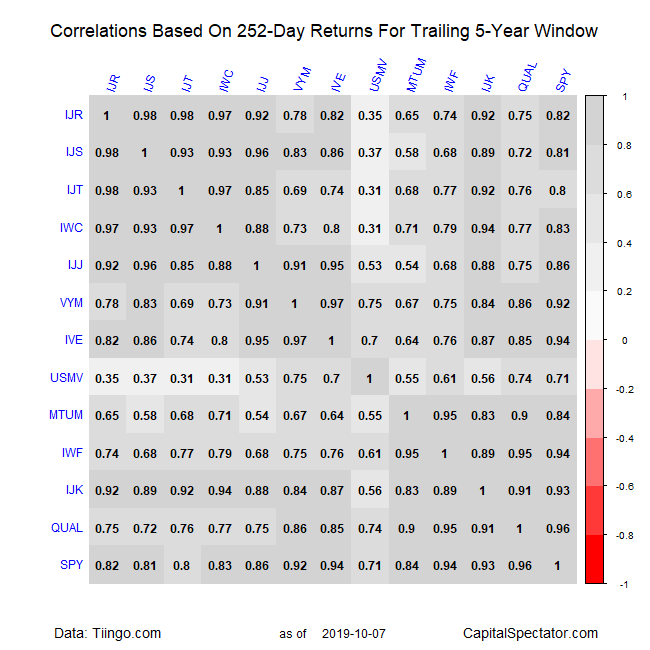
The results above imply that diversifying a US equity allocation through a mix of factors can be productive, with limits. If you’re looking for a deeper level of diversification you’ll have to look beyond the US equity space and/or employ more aggressive forms of equity management – merger arbitrage, for instance.
Finally, don’t forget that measuring diversification by way of correlation is a good way to begin the analysis, but it’s hardly the last word on the subject. There are several methodologies for quantifying the degree of diversification for a set of assets. Correlation deserves to be on the short list, but like every other metric it has its own set of pros and cons.
Disclosure: None.


