
Major US Equity Indices Show Indecision
It is early to declare that a trend is beginning, but last week was the first time in a while that major US equity indices were indecisive, showing early signs of fatigue. This is coming at a time when ratios of small-caps versus large-caps and offensives versus defensives are at a crucial juncture.
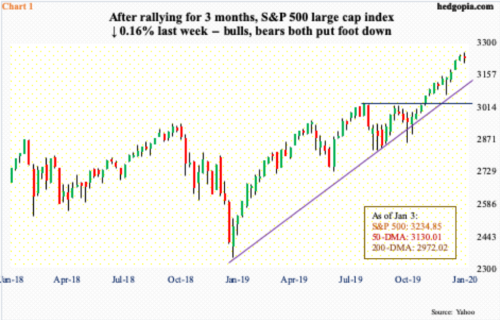
Until Thursday last week, major US equity indices were cruising along, with the S&P 500 large cap index rising to 3258.14, the Dow Industrials to 28872.80 and the Nasdaq Composite to 9093.43 – all new all-time highs. In the year’s first session, stocks essentially picked up where they left off 2019; by then, they were respectively up 0.56 percent, 0.79 percent and 0.96 percent for the week. Then came geopolitics-driven Friday’s drop that ended the week down 0.16 percent, down 0.04 percent and up 0.16 percent, in that order. All three indices formed a spinning top on the weekly. The candle indicates indecision, with neither bulls nor bears able to exert control. This preceded massive rallies since the lows of early October. If this is a trend reversal, it needs confirmation. This week’s candle therefore is important.
In the event that stocks come under pressure, on the S&P 500 (3234.85) there is support at 3120s, which represents trend-line support from the lows of December 2018. Then, there is horizontal support at 3020s (Chart 1). The latter is important for bulls to defend.
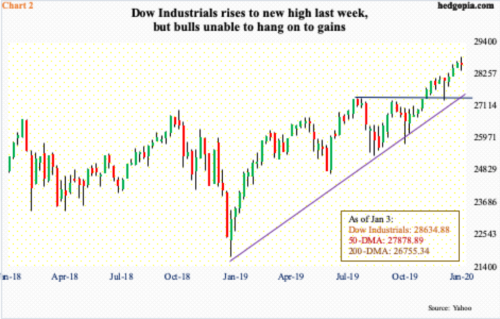
On the Dow Industrials (28634.88), trend-line support from December 2018 lies at 27500, which approximates horizontal support from mid-July last year (Chart 2).
Conditions are extended. Through last Thursday’s high, the Dow rallied 12-plus percent in three months. Throughout this, dips have been bought. Even last week, bulls stepped up in defense of the 10-day, which is still rising. For bears to get traction, this average, along with the 20-day, needs to at least flatten out and then roll over.
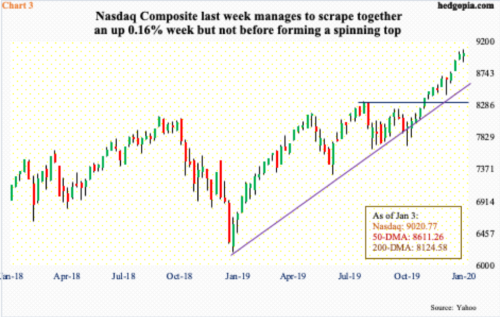
These two averages last week were also defended on the S&P 500 as well as the Nasdaq Composite (9020.77). On the latter, the trend line from December 2018 extends to 8550. After that lies horizontal support at 8330s (Chart 3).
Importantly, the weekly RSI on the Nasdaq closed last week at 74.9; on the S&P 500 and the Dow, it was 73.6 and 69.8 respectively. On the daily, however, RSI has gone under 70 on all three indices – 68.3, 65.7 and 62.2, in that order. Momentum is slowing down.
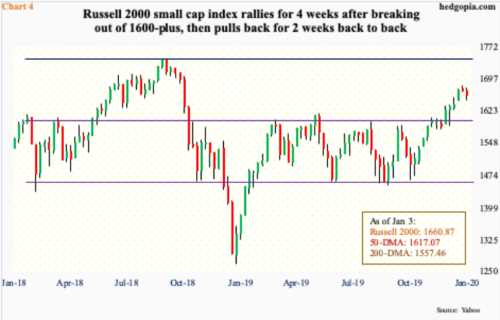
Small-caps are no exception. In fact, the Russell 2000 small cap index (1660.87) suffered a back-to-back down week last week.
The recent high of 1681.68 was posted five sessions ago, on December 27. This preceded a major breakout late November at just north of 1600. Prior to that, the Russell 2000 was caught in a rectangle. Using a measured-move approach, breakout traders were probably eyeing the all-time high from August 2018 when the index peaked (Chart 4). But it is struggling to build further on that breakout. In fact, once again, it is possible it is leading large- and mid-caps lower.
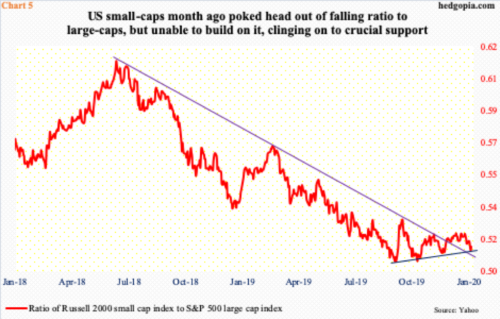
From this respect, Charts 5 and 6 have both reached a crucial juncture.
Chart 5 is a ratio between the Russell 2000 and the S&P 500. A month ago, it broke through a falling trend line from June 2018, but building on it has proven tough. It has rolled over and is currently clinging on to four-month trend-line support.
Since Boxing Day, small-caps have once again lagged large-caps.
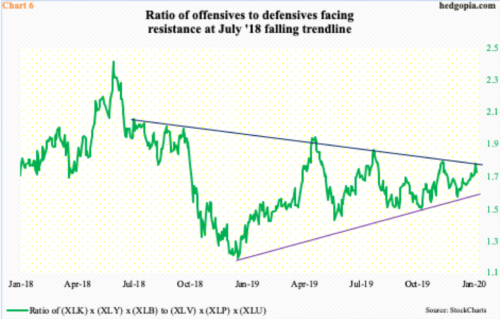
Then, there is Chart 6, which uses six SPDR ETFs to create a ratio between offensive and defensive sectors. XLK (technology), XLY (consumer discretionary) and XLB (materials) are treated as offensive and XLV (health care), XLP (consumer staples) and XLU (utilities) defensive.
The ratio bottomed in December 2018 and has since made higher lows. At the same time, rally attempts have been bound by a falling trend line from July that year. Last Thursday’s 1.767 kissed that trendline, with Friday turning lower at 1.718. The lower trend line gets tested at 1.611. This is a potential risk right now for equity bulls.
An environment in which defensives lead and small-caps lag is a fertile ground for risk-off sentiment.


