
Major Indices Face Moving-Average, Fibonacci Resistance – Money-Market Funds Hold Key
Major US equity indices are facing moving-average as well as Fibonacci resistance. The path of least resistance is down near term, with decent support not too far away. For this to hold, money-market funds hold the key.
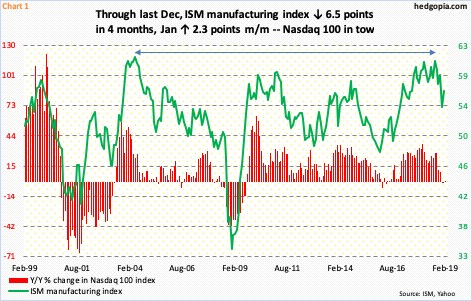
Since peaking at 60.8 in August last year, the ISM manufacturing index shed 6.5 points in four months before printing 54.3 in December. January was up 2.3 points month-over-month. The August reading was the highest since hitting 61.4 in May 2004. It is hard to sustain above 60. Several times in the past, the index has tended to peak at high-50s/low-60s, before coming under sustained pressure. Hence, it is too soon to say if December’s was a durable bottom. The economic cycle is getting long in the tooth. The recovery is on the verge of completing a decade. Great Recession ended in June 2009.
Historically, US stocks, in general, tend to move in tandem with manufacturing. Chart 1 plots the year-over-year change in the Nasdaq 100 index with the ISM manufacturing index. Most recently, the red bars began to drop in January last year. The ISM index hit 60.7 in February (last year). Should the green line weaken in months/quarters to come – probable – the Nasdaq 100 should follow.
The index currently sits at an interesting juncture.
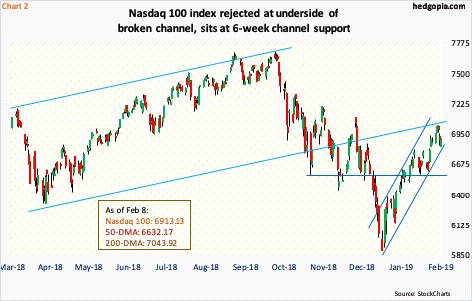
Early October last year, the Nasdaq 100 peaked intraday at 7700.56. By Christmas Eve, it had collapsed 23.4 percent. From that low through last Wednesday, it then rallied 19.3 percent.
Importantly, a 61.8-percent retracement of the October-December decline rests at 7011. Last Wednesday’s high was 7034.94. Fibonacci followers pay close attention to this retracement and is often a spot where resistance tends to be stiff. Last week’s high also tested the 200-day moving average – unsuccessfully.
During the October drawdown, the Nasdaq 100 (6913.33) also fell out of an ascending channel (Chart 2). Last week’s high was rejected at the underside of that broken channel. Concurrently, since the late-December low, the index pretty much traded within a sharply rising channel. A breakdown can accelerate selling. The 50-day lies at 6632.17. Daily conditions, in particular, are deeply overbought. The index has now rallied for seven straight weeks, but last week produced a candle with a long wick.
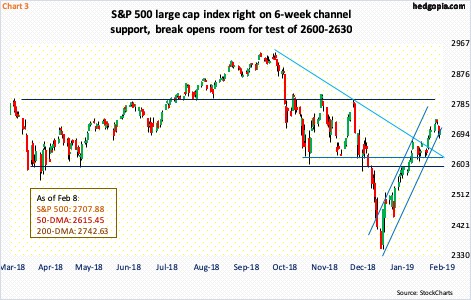
It is the same story with the S&P 500 large cap index (2707.88). It rallied in six of the last seven weeks, with last week essentially flat with a long-legged doji. As was the case with the Nasdaq 100, it too faced resistance last week at the 200-day. And as was the case with the Nasdaq 100, the S&P 500 just retraced 61.8 percent of the early October-late December decline, which lies at 2713. Last week’s high was 2738.98. From the late-December low through that high, the S&P 500 added 16.7 percent.
Along the way, the index has repaired at least some of the damage wrought during the October-December rout. For nearly all of last year, the S&P 500 traded within a box, with 2800 above and 2600 below. The lower bound was lost mid-December, which led to an acceleration in selling. After it bottomed on Boxing Day, the index not only proceeded to recapture 2600-2630 but also a falling trend line from late October (Chart 3). Concurrently, post-December low, it traded within an ascending channel; it closed Friday right on the lower bound. A breakdown opens the door for a retest of 2600-2630. The 50-day lies right around there. The daily chart is way extended.
This is also true with the Russell 2000 small cap index.
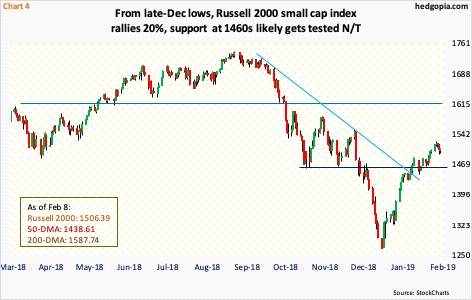
Unlike the S&P 500 and the Nasdaq 100 index, the Russell 2000 (1506.39) peaked much earlier last year – on August 31 at 1742.09, to be precise. As with the other two indices, the Russell 2000 began to fall apart early October. By Christmas Eve, it had lost 27.3 percent, in the process losing crucial support at just north of 1600 (Chart 4). This was followed early December by loss of 1460s, which has now been retaken. Through last Tuesday’s high of 1524.21, the Russell 2000 rallied 20.3 percent. Conditions – particularly daily – are deeply overbought.
Last week’s high was smack in the middle of the 50- and 200-day. From Friday’s close, the Russell 2000 has to rally another 5.4 percent to test the 200-day. Similarly, last Tuesday’s high fell 2.4 percent short of completing 61.8-percent retracement of the August-December decline. A test likely does not happen at least in the sessions ahead.
After six consecutive up weeks, last week was up 0.3 percent, but the Russell 2000 was unable to hang on to the gains, resulting in a candle with a long wick. Signs of fatigue are showing up. The daily in particular is grossly extended.
In the event of weakness ahead, small-cap bulls can step up at the 1460s (Chart 4) on the Russell 2000, with the 50-day at 1438.61. Similarly, on the S&P 500, the 50-day approximates support at 2600-2630 (Chart 3). And on the Nasdaq 100, there is decent support at 6600 (Chart 2), with the 50-day at 6632.17. This is the risk near term for longs.
Bulls have done a good job of erasing a good portion of the loss suffered in October-December, but it is possible – even probable – they have hit the wall for now. For the afore-mentioned support to hold, funds need to cooperate.
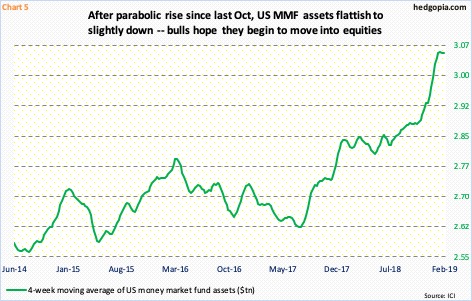
As stocks began to unravel early October, US money-market assets began to rise – from $2.87 trillion in the week ended October 3 to $3.06 trillion as of last Wednesday, although they are slightly down from $3.07 trillion four weeks ago. The four-week moving average in Chart 5 is slightly under pressure since peaking at $3.05 trillion two weeks ago. Consequently, the green line is hooking down a tad. Particularly since last July, these assets have gone up sharply, and can potentially act as dry powder. This is bulls’ dream-come-true scenario in which funds begin to move from money markets into equities. That said, even after a monstrous rally in January, money-market assets kept rising. This needs to change. Else, bears in due course would be gunning for the lows of late December.
Disclaimer: This article is not intended to be, nor shall it be construed as, investment advice. Neither the information nor any opinion expressed here constitutes an offer to buy or sell any ...
more

