
Macro USD Fragility In A Context Of Rising Equities
Narrative In Financial Markets
The overarching theme this week is the dovish turnaround by the FOMC on Wednesday, which has obviously had major knock-on effects in the psyche of the market. To start off, as I show in today’s report, the bear steepener dynamics in the US yield curve is a hint that the market is now pricing in a rate cut as the next move by the Fed, even if far from an immediate outcome.
In the last 24h, the Euro has come under renewed pressure as headlines from ECB’s Weidmann warned us that the German GDP will probably dip well below the 1.5% mark. We had already learned via the German government that they had revised its yearly GDP forecast to ~1%, still, the Euro found a wave of selling-pressure to pare most of its FOMC-induced gains. It’s hard to fathom EUR upside as a function of the merits in the EU economy.
Another major story markets are tracking very closely, even if there are no signs of an immediate resolution, is the US-China trade talks. Pencil in this data folk, March 1st, that’s when the punitive increase of 25% in tariffs to China comes into effect. Since the US aims for a meticulously comprehensive deal with high guarantees of commitment by the Chinese, this is probably a story to still drag on for weeks. Nonetheless, US President Trump said talks are “going well” but a meeting Trump-Xi will still be required.
The next focal points shift towards the European flash CPI data, the US non-farm payrolls, and the US ISM manufacturing PMI. In terms of US data, given the prolonged US shutdown during the month of January, the bar has been set fairly low for today’s figures. If the changes in the 25-delta risk reversals in the options market are any indication, the market suspects a poor showing.
Just be aware, the jobs market is no longer the number 1 driver of Fed policies, so any NFP-led vol should be taken with a bucket of salt, especially in a bear steepener US yield curve. In other words, there are heightened risks of fading a positive read given the macro reset since the FOMC dovish shocker.
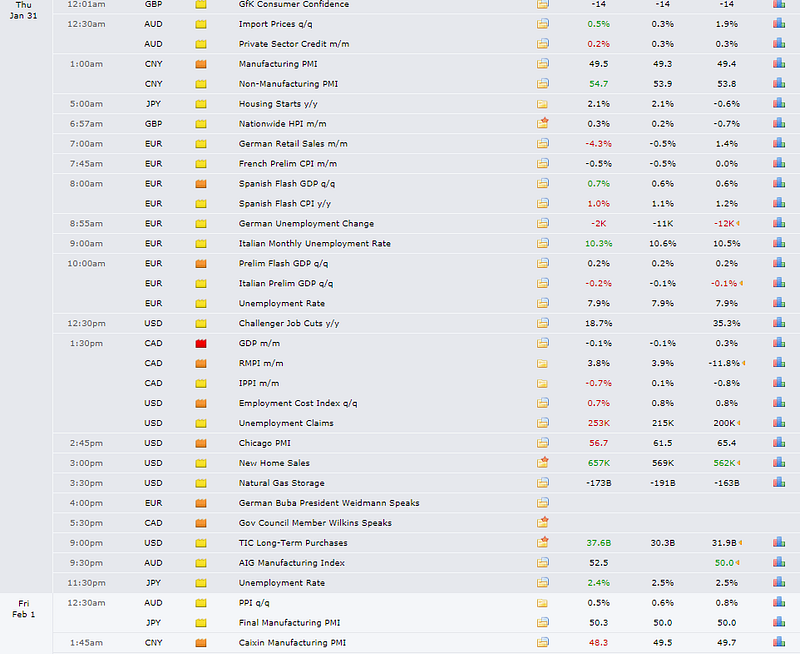
Find today’s events below:
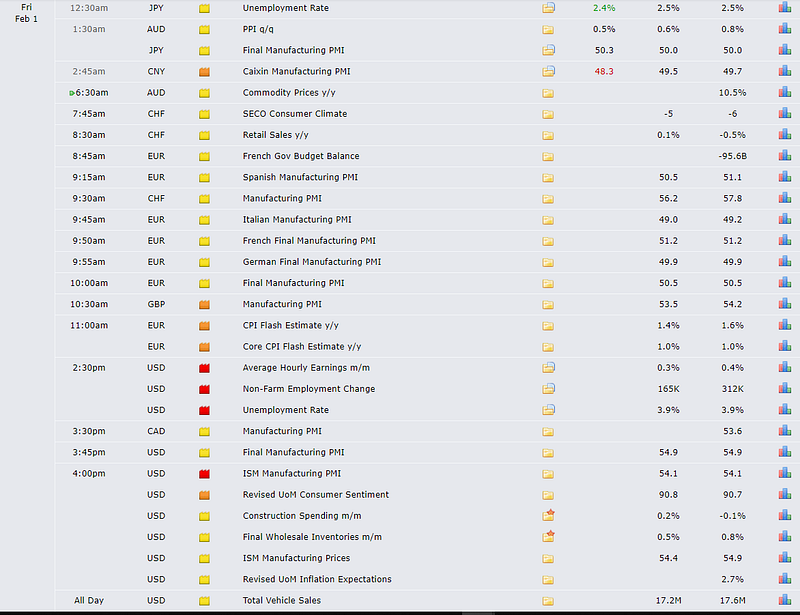
Source: Forexfactory
Chart Insights: USD/JPY An Attractive Short Outlook
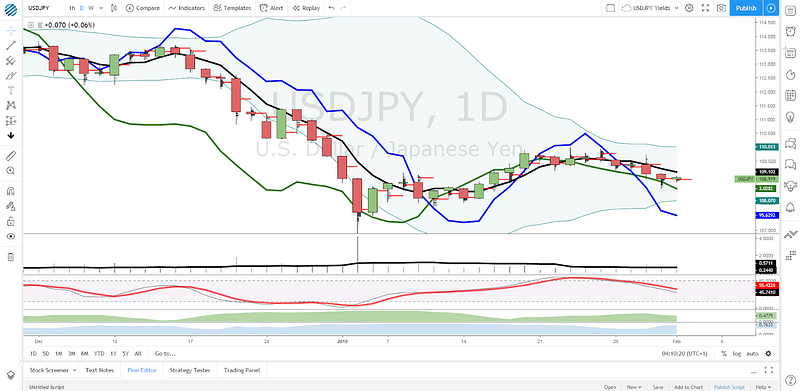
Looking to engage in USD/JPY shorts as an overall bias looks like a sensible strategy. Vol is due on the US NFP, but spotting potential intraday opportunities make perfect sense as the general market conditions stand.
We have the momentum behind price action and correlated assets converging (DXY, US 30-year bond yield) in the same direction through the 5-DMA. Besides, the options market is pricing Calls in Japanese Yen significantly more expensive than 24h ago heading into the US NFP.
Sell-side action would also play in line with the current market narrative clearly dominated by broad-based USD weakness. The bullish acceleration in the S&P 500 has been capping the downside, but any stabilization in the rate of gains may see the bearish bias resume vigorously.
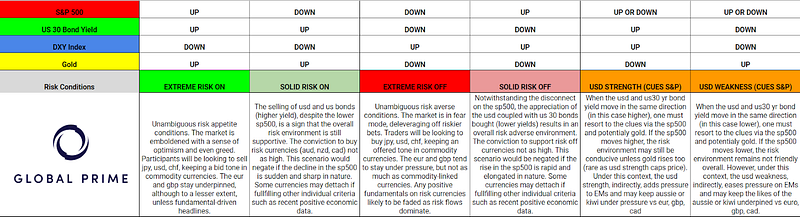
RORO Model: Risk-On Risk-Off Conditions
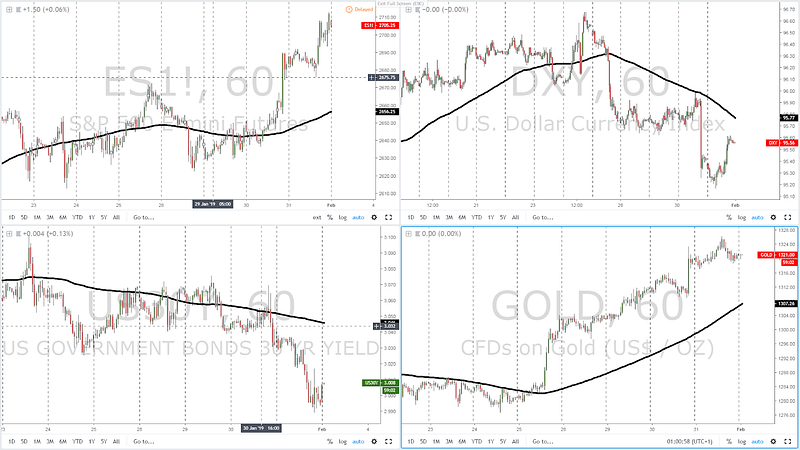
The slope of the 5-dma as part of the risk model monitored has gravitated towards an environment characterized by US Dollar weakness as reflected by the acceleration in the US 30Y and the DXY in response to the FOMC dovish outcome from Wednesday. The downward dynamics in the USD are further anchored by the market structure of LL-LH based on Dow theory.
Whenever we are faced with USD-centric movements ruling currencies, we need to seek out the cues off the equity market to gauge the market sentiment. On Thursday, even as the US30Y kept pressing lower to test the 3% handle and the DXY underwent a correction higher (capping gold upside), it was the S&P 500 and its bullish extension that determined the lingering sanguine mood in currencies, resulting in a lower Japanese Yen as US markets got underway, with commodity-linked FX supported.
Yield Curve: Outlook For Growth, Inflation & Policies
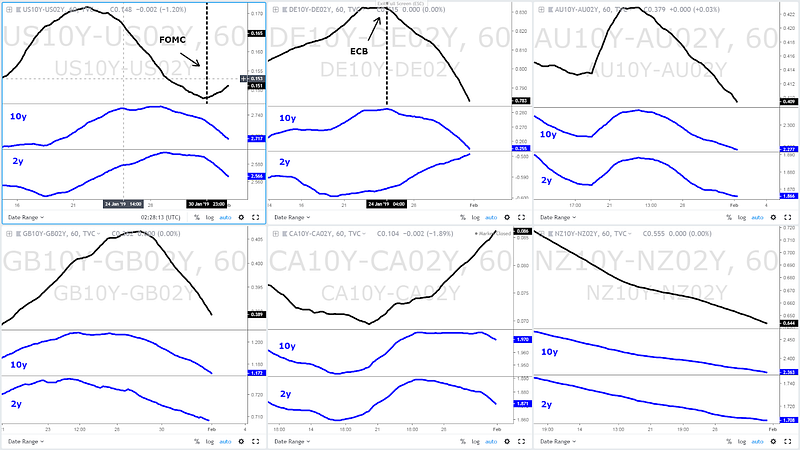
United States: The FOMC has represented a watershed moment in the dynamics of the US yield curve, with the market clearly transitioning into a bull steepener phase as depicted by the change in slope in the 5-dma. We are faced with a situation where short-term US yields are dropping faster than the long-term maturities. Whenever this is the case, we have a market sending us a troublesome message towards the US economy. It essentially communicates that economic growth is decelerating in an environment of low inflation. In this scenario, the market is pricing in that the next move by the Central Bank will be a cut in interest rates.
Europe: The curve has been in a mixed-bag flattening phase with the 10y yield dropping very aggressively as the slowdown in the Eurozone takes its toll in sentiment, which leads to investors bidding up long-dated bonds as a vehicle to protect the headwinds of the economy, exacerbated by the slowdown of the Chinese economy, of which Europe has become heavily dependent. For instance, the German IFO and the Chinese 10y bond yield have built an intimate correlation in recent times. The dovish admissions by the ECB last week was also a major catalyst leading up to the purchase of German bonds as the Central Bank mulls a potential return to unorthodox policies if the slowdown in the Eurozone does not stabilize in the foreseeable future. Interestingly, the 2y German bund yield has been rising, but I wouldn’t read too much into it since it’s trading a negative rate of nearly 6bp.
Australia: The reads leaves little room for doubt. The Aussie economy is in a very fragile position as the bull flattener communicates, and manifested by the astounding drop in consumer confidence (Westpac survey), business conditions are also falling off a cliff (NAB survey). This adds to the mounting fears in the housing market, with up to 70% of all Australians’ households wealth tied up in some form to housing. The feedback loop into the real economy is real and as a result, bond traders are telegraphing that the RBA may ultimately have no choice but to cut rates. Be mindful, the latest upbeat headline Aus CPI data has not budged the bull flattening dynamics.
United Kingdom: The UK government has been involved in an exercise, via the Brexit amendments vote this week, aimed at getting further reassurance that the UK won’t accept a Hard Brexit. We come from a bear steepener period where long-term bond yields increased faster than short-term amid hopes that the UK will be extending the article 50 or a 2nd referendum on Brexit was being considered as a not so distant prospect. This week, however, bonds traders are communicating to us that such bullish view on the UK economy was far-fetched and the reality of a bull flattener sinks in as the EU has maintained its hard-line stance by giving 0 hints on concessions that involve the Irish backstop. In this environment, the demand for GBP should recede.
Canada: Unlike the US, the long-dated bond yield in Canada has been very well sustained while the short-term end is starting to accelerate its fall, even if that’s still within the context of bullish dynamics. These movements in the yield curve since mid-Jan has resulted in what’s known as a bear steepener, which foretells positive news about the economy. It suggests the market expects the Canadian GDP to accelerate even if the inflation is still well contained, or else we’d see the short-dated 2-year bond yield track much closer the move by the 10y yield. The rise in Oil prices, recovering with a strong momentum off the lows during January has improved the outlook.
New Zealand: Even as the S&P Rating Agency upgraded the country at AA with a stable outlook. Bond vigilantes were absolutely undeterred, placing far more weight to the current negative dynamics dominating the New Zealand economy, as manifested by the bull steepener phase, where long-term yields drop faster than short-term, which is a dovish scenario in which the RBNZ is at risk of cutting rates. As one can observe, New Zealand is following in locksteps Australia here.
Notes:
*Bear Flattener: Short-term yields increase faster vs long-term yields (slower economic growth, relatively strong FX keeps CPI low, Central Bank in pause)
*Bear Steepener: Long-term yields increase faster vs short-term yields (economy in accelerating growth phase, Central Bank should raise rates)
*Bull Flattener: Long-term yields drop faster vs short-term yields(decelerating economic growth, depressed inflation, risk Central Bank lowers rates)
*Bull Steepener: Short-term yields drop faster vs long-term yields (decelerating economic growth, no inflation, Central Bank must cut rates)
Fundamentals & Heat Map Table
In the last 24h, we’ve been able to gather further evidence over the substantial slowdown experienced by the Chinese economy, in particular, its manufacturing sector as the trade war takes its toll in the supply chain of the equation. Talk has it that the PBOC is looking to further stimulate the economy by cutting the benchmark interest rate. It looks as though the existing easing measures implemented are not enough to improve the tighter financial conditions in the real economy, which occurs with the added disturbance of a bearish business cycle, rising credit risk, and low inflation.
Some of the additional headlines that grabbed my attention included the technical recession in Italy after a -0.2% Q4 preliminary print, with Canada’s GDP also exhibiting a minor recession in Dec.
Access our heatmap tables organized by countries in the following link.
In the vast majority of cases, you will be able to connect the dots between a country’s yield curve, which accounts for the outlook in growth and inflation, and the current fundamentals — economic conditions — in the country. The right interpretation of the yield curve is the best foretelling tool in existence for future economic news.
Today, I want to bring to your attention the dire economic situation facing the Eurozone. Whatever measure one looks at, its abundantly clear that under such circumstances, the ECB is in no position to increase its interest rate or remove much liquidity from the markets anytime soon. The latest ECB monetary policy meeting was a testament of the Central Bank caving in by downgrading its outlook while acknowledging that unorthodox tools such as reinvestment of bond maturities, TLTROs and other creative ways to keep ample liquidity into the system are very much on the table.
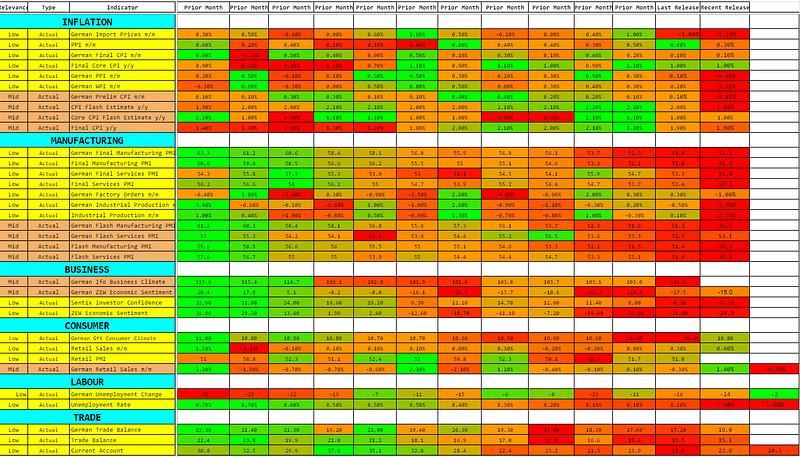
Source: Global Prime, Forexfactory
Options — 25 Delta RR & Vols
The most notable changes in the slope of the call/put vol curves are seen in the Euro, where the 25 delta risk reversal has turned positive. Lagging behind is the Sterling, which has seen calls get a slight mark-up in prices vs the Puts. The Japanese Yen exhibits one of those rare occurrences where the deterioration in the 25-delta RR (higher premiums to own JPY calls) has jumped significantly at a time when the options market expected heightened vol owed to the US NFP. Not surprisingly, and potentially anticipating the poor Chinese PMI just out at 48.3 vs 49.6 exp, the Aussie 25-delta RR has fallen to -0.7, which is a fairly rampant move in interest to own Puts. Lastly, the options market is turning more constructive in the outlook for the USD/CAD as Calls have gone up in pricing.
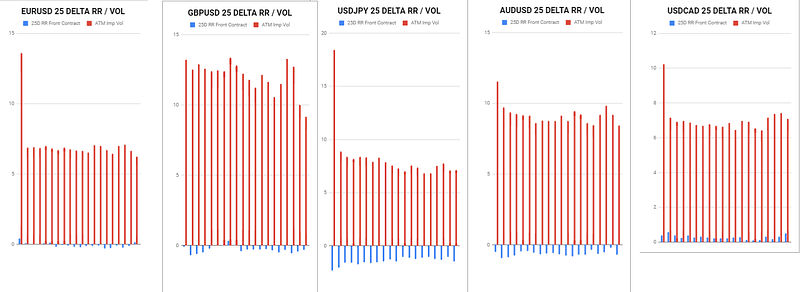
* The 25-delta risk reversal is the result of calculating the vol of the 25 delta call and discount the vol of the 25 delta put. … A positive risk reversal (calls vol greater than puts) implies a ‘positively’ skewed distribution, in other words, an underperformance of longs via spot. The analysis of the 25-delta risk reversals, when combined with different time measures of implied volatility, allows us to factor in more clues about a potential direction. If the day to day pricing of calls — puts increases while there is an anticipation of greater vol, it tends to be a bullish signal to expect higher spot prices.
Source: http://cmegroup.quikstrike.net (The RR settles are ready ~1am UK).
Options — Ratio Imp/Hist Vol
Find below today’s implied / historical vol levels.
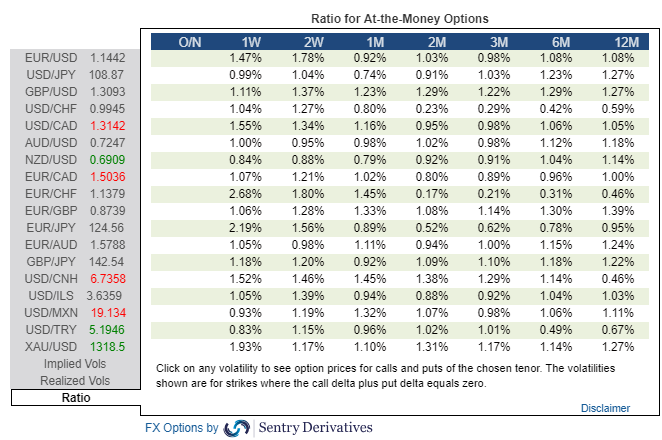
* If implied vol is below historical vol, represented by a ratio < 1% in the table above, the market tends to seek equilibrium by being long vega (volatility) via the buying of options. This is when gamma scalping is most present to keep positions delta neutral, which tends to result in markets more trappy/rotational. On the contrary, if implied vol is above historical vol, represented by a ratio > 1%, we are faced with a market that carries more unlimited risks given the increased activity to sell expensive volatility (puts), hence why it tends to result in a more directional market profile when breaks occur. The sellers of puts must hedge their risk by selling on bearish breakouts and vice versa.
Important Footnotes
- Risk model: The fact that financial markets have become so intertwined and dynamic makes it essential to stay constantly in tune with market conditions and adapt to new environments. This prop model will assist you to gauge the context that you are trading so that you can significantly reduce the downside risks. To understand the principles applied in the assessment of this model, refer to the tutorial How to Unpack Risk Sentiment Profiles
- Cycles: Markets evolve in cycles followed by a period of distribution and/or accumulation. The weekly cycles are highlighted in red, blue refers to the daily, while the black lines represent the hourly cycles. To understand the principles applied in the assessment of cycles, refer to the tutorial How To Read Market Structures In Forex
- POC: It refers to the point of control. It represents the areas of most interest by trading volume and should act as walls of bids/offers that may result in price reversals. The volume profile analysis tracks trading activity over a specified time period at specified price levels. The study reveals the constant evolution of the market auction process. If you wish to find out more about the importance of the POC, refer to the tutorial How to Read Volume Profile Structures
- Tick Volume: Price updates activity provides great insights into the actual buy or sell-side commitment to be engaged into a specific directional movement. Studies validate that price updates (tick volume) are highly correlated to actual traded volume, with the correlation being very high, when looking at hourly data. If you wish to find out more about the importance tick volume, refer to the tutorial on Why Is Tick Volume Important To Monitor?
- Horizontal Support/Resistance: Unlike levels of dynamic support or resistance or more subjective measurements such as Fibonacci retracements, pivot points, trendlines, or other forms of reactive areas, the horizontal lines of support and resistance are universal concepts used by the majority of market participants. It, therefore, makes the areas the most widely followed and relevant to monitor. The Ultimate Guide To Identify Areas Of High Interest In Any Market
- Trendlines: Besides the horizontal lines, trendlines are helpful as a visual representation of the trend. The trendlines are drawn respecting a series of rules that determine the validation of a new cycle being created. Therefore, these trendline drawn in the chart hinge to a certain interpretation of market structures.
- Correlations: Each forex pair has a series of highly correlated assets to assess valuations. This type of study is called inter-market analysis and it involves scoping out anomalies in the ever-evolving global interconnectivity between equities, bonds, currencies, and commodities. If you would like to understand more about this concept, refer to the tutorial How Divergence In Correlated Assets Can Help You Add An Edge.
- Fundamentals: It’s important to highlight that the daily market outlook provided in this report is subject to the impact of the fundamental news. Any unexpected news may cause the price to behave erratically in the short term.
- Projection Targets: The usefulness of the 100% projection resides in the symmetry and harmonic relationships of market cycles. By drawing a 100% projection, you can anticipate the area in the chart where some type of pause and potential reversals in price is likely to occur, due to 1. The side in control of the cycle takes profits 2. Counter-trend positions are added by contrarian players 3. These are price points where limit orders are set by market-makers. You can find out more by reading the tutorial on The Magical 100% Fibonacci Projection
The Daily Edge is authored by Ivan Delgado, Head of Market Research at Global Prime. The purpose of this content is to provide an assessment of the market conditions. The report takes an in-depth ...
more

