
Lucky 7's In A Broadening Equity Market
With eleven months of the year behind investors, 2025 has been a rewarding one as most investment categories have generated positive returns. The S&P 500 Index is up 17.81% on a total return basis and many international markets are positive too with the S&P Developed ex-U.S. BM Index up 29.84%. Below is a table showing the return of various indexes/factors sorted on the 1-month column. The last column shows YTD returns and most categories are positive.

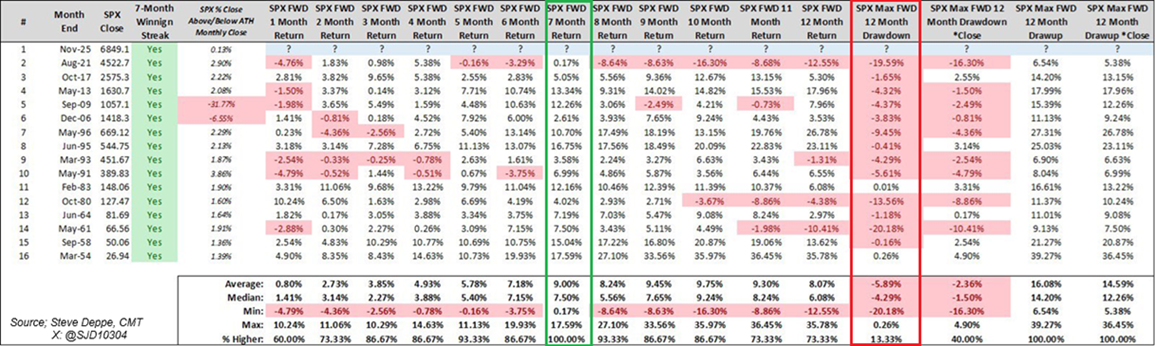
The S&P 500 Index ended November with a small positive return of .25% and making it the seventh consecutive month that the Index generated a positive return.

This also represents the fifteenth time since 1950 the Index has had a seven-month winning streak. In the prior instances, the index never closed lower seven months later as seen highlighted with the green box in the below table. And as one should expect, there are time frames subsequent to this winning streak where negative returns occur, but the market's long-term trend is one that historically sees it move higher over time.
(Click on image to enlarge)
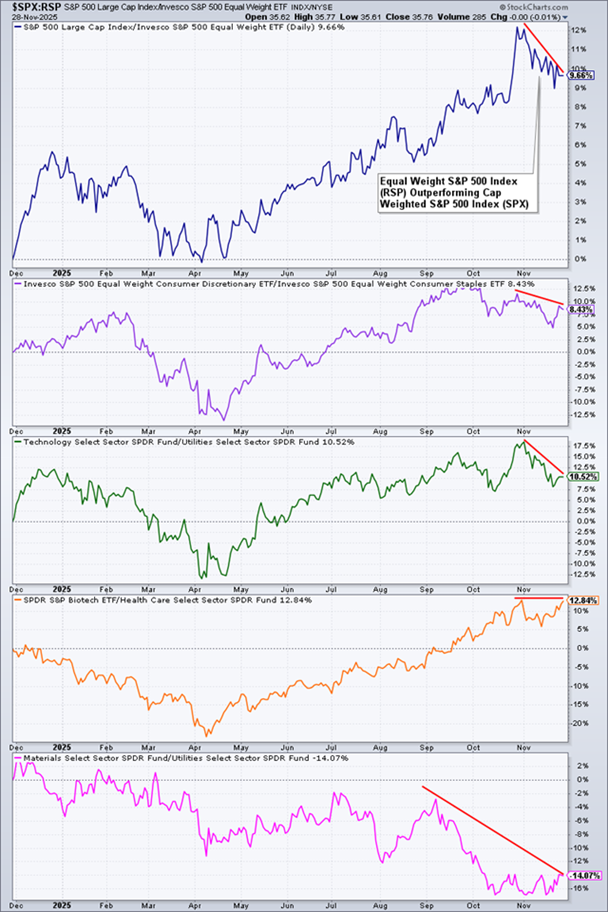
Another potential positive with the current market is it appears the market's return is being generated by more stocks other than just the Magnificent 7 (MAGS) stocks. This is evident from a number of factors, one seen in the return table noted at the beginning of this post that shows small and mid-size company stocks outpacing large cap stocks. Looking at the S&P 500 Equal Weighted Index (RSP), the downward sloping line in the top panel of the below chart indicates it has outperformed the cap weighted S&P 500 Index (SPY) for the month of November. Additionally, other sectors are beginning to see stronger performance like Consumer Staples, Utilities and Health Care.
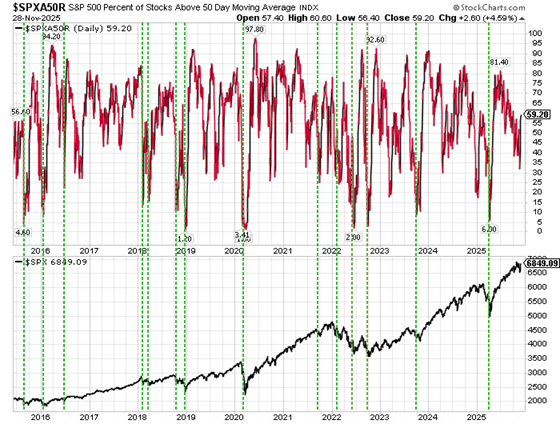
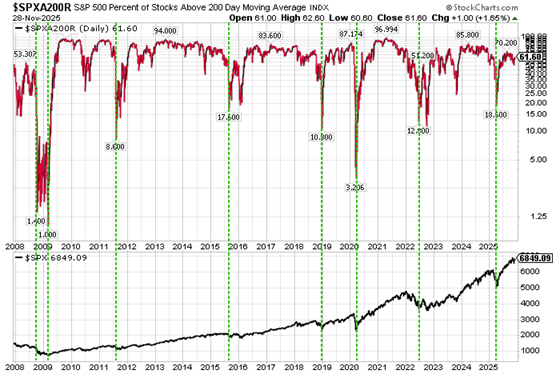
Another sign of a broadening market is looking at the percentage of stocks trading above their 50- and 200-day moving average. The two charts below show 59% of S&P 500 stocks trading above their 50-day M.A and 61% trading above their 200-day M.A. These percentage are higher than when the month of November began and a sign of a larger number of stocks moving higher, i.e., broader market participation.
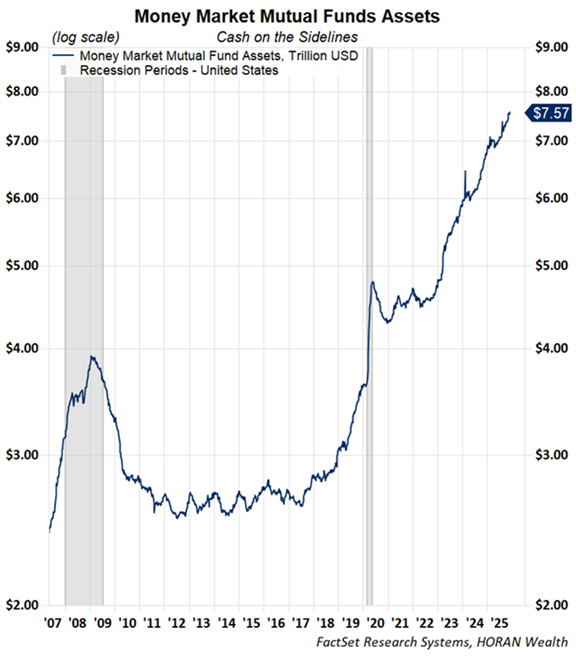
Lastly, given the fact the S&P 500 Index has generated a positive return for seven consecutive months through the end of November, a pullback to digest these gains would not be unexpected. However, with a large amount of cash on the sidelines or in money market funds as seen in the below chart, over a record $7.5 trillion, a pullback might entice investors to buy stocks with some of their cash. Some of this will be predicated on the state of the economy and that seems to be improving at the moment as well.
Given the market seems to be broadening out in terms of stock participation, a further market advance could unfold for the balance of the year and into 2026.
More By This Author:
Dogs Of The Dow Continue Outperforming Broader Market
A Stock Buyback Strategy Can Provide Balance
Mixed Market Sentiment In An Improving Economy
Disclaimer: The information and content should not be construed as a recommendation to invest or trade in any type of security. Neither the information nor any opinion expressed constitutes a ...
more

