
Looking Into The Future Thru Futures, What Hedge Funds Bought This Week
Following futures positions of non-commercials are as of April 6, 2021.
10-year note: Currently net long 84.6k, up 174.4k.
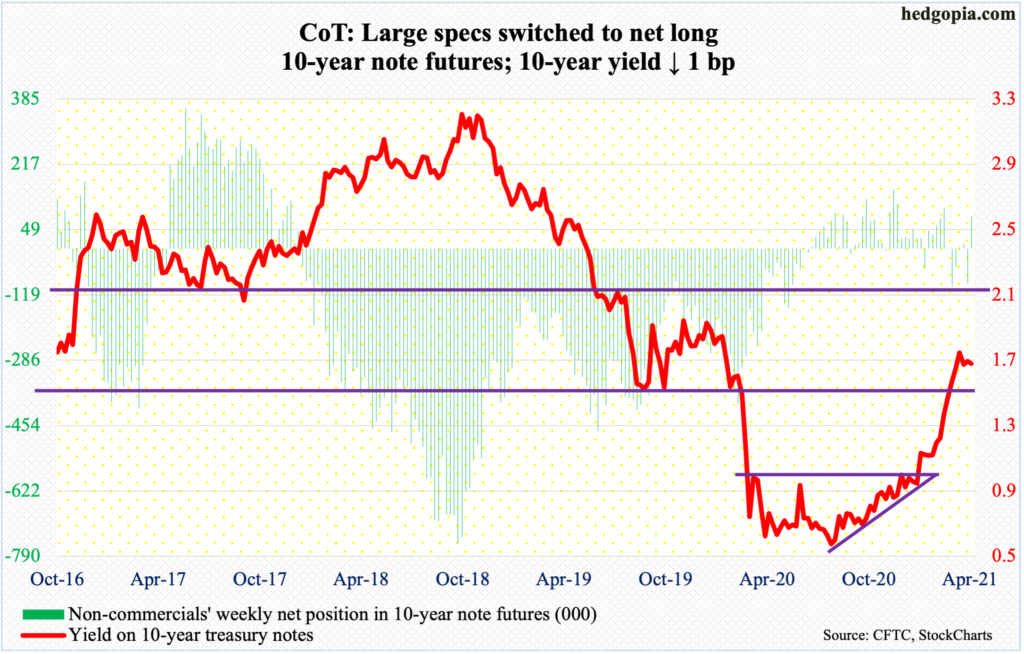
On March 17, the 10-year treasury yield broke out of 1.63 percent, subsequently rallying to 1.77 percent by the 30th. Rates then came under pressure, with Thursday closing right at 1.63 percent and Friday rising three basis points to 1.67 percent. So far so good. Bond bears (on price) have defended the breakout retest.
But it is too soon to say rates are done going down. The weekly in particular remains way overbought. The 10-year has come a long way, having bottomed at 0.4 percent in March last year.
Structurally, the 10-year acts healthy, with several breakouts this year, having broken out of one percent early this year, 1.2 percent mid-February and 1.4 percent toward the end of that month.
A test of 1.4 percent is probable at some point, which by default suggests a breach of 1.63 percent in due course.
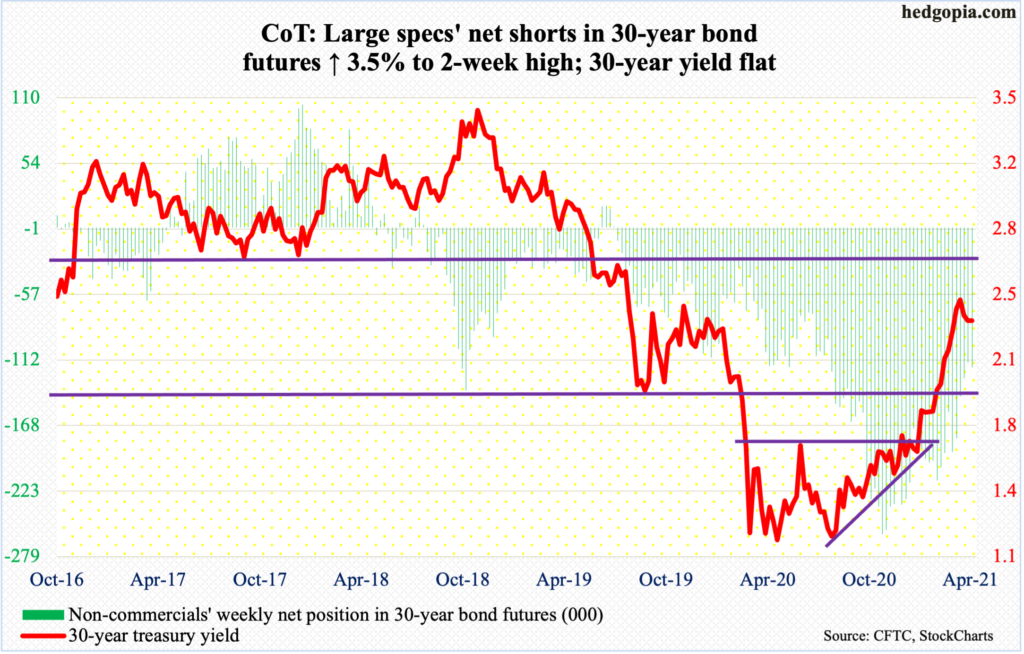
30-year bond: Currently net short 118.5k, up 4.1k.
Major economic releases for next week are as follows.
The NFIB Optimism Index (March) and the consumer price index (March) come out on Tuesday.
Small-business optimism inched up eight-tenths of a point month-over-month in February to 95.8. Post-pandemic, the index posted a low of 90.9 last April.
In February, core CPI decelerated to growth of 1.28 percent year-over-year, edging up 0.1 percent m/m. The headline CPI increased 0.4 percent m/m and 1.68 percent y/y.
Thursday brings retail sales (March), industrial production (March), the NAHB Housing Market Index (April) and Treasury International Capital data (February).
Retail sales in February dropped three percent from January’s seasonally adjusted annual rate of $579.1 billion, which was a record.
Capacity utilization declined 2.3 percent m/m in February to 73.8 percent. January’s 75.5 percent was an 11-month high.
March homebuilder confidence declined two points m/m to 82. Last November, confidence hit a record 90, having tripled from last April’s 30.
In the 12 months to January, foreigners purchased $374.6 billion in US equities – a record. This represents quite a U-turn from April 2019 when they sold $214.6 billion worth – also a record.
Housing starts (March) and the University of Michigan’s consumer sentiment index (April, preliminary) are scheduled for Friday.
Starts tumbled 10.3 percent m/m in February to 1.42 million units (SAAR). Last December, starts hit 1.67 million units, which was the highest since September 2006. Last April, starts tumbled to 934,000, which was the lowest since February 2015.
Consumer sentiment in March jumped 8.1 points m/m to 84.9 – a 12-month high. Pre-pandemic, sentiment hit 101 in February last year.
WTI crude oil: Currently net long 548.6k, down 17.1k.
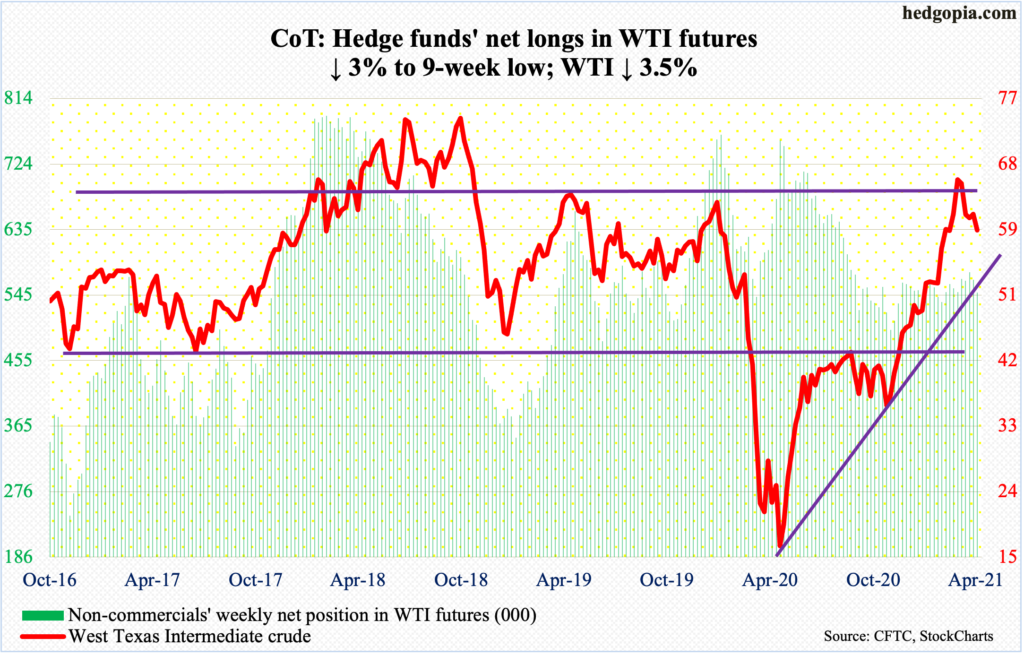
One more week and one more week of activity around the 50-day. In all five sessions this week, WTI ($59.32/barrel) traded under the average, but barely. It has now been 16 sessions the crude has straddled the 50-day ($60.39).
As this unfolded, bulls have carved out decent support at $58. A breach exposes WTI to $52-$54.
In the meantime, per the EIA, US crude production in the week to April 2 declined 200,000 barrels per day to 10.9 million b/d. Crude stocks dropped as well, down 3.5 million barrels to 498.3 million barrels. Stocks of gasoline and distillates, however, rose – up four million barrels and 1.5 million barrels to 234.6 million barrels and 145.5 million barrels, in that order. Crude imports increased as well, which were up 119,000 b/d to 6.3 mb/d. Refinery utilization edged up one-tenth of a percentage point to 84 percent.
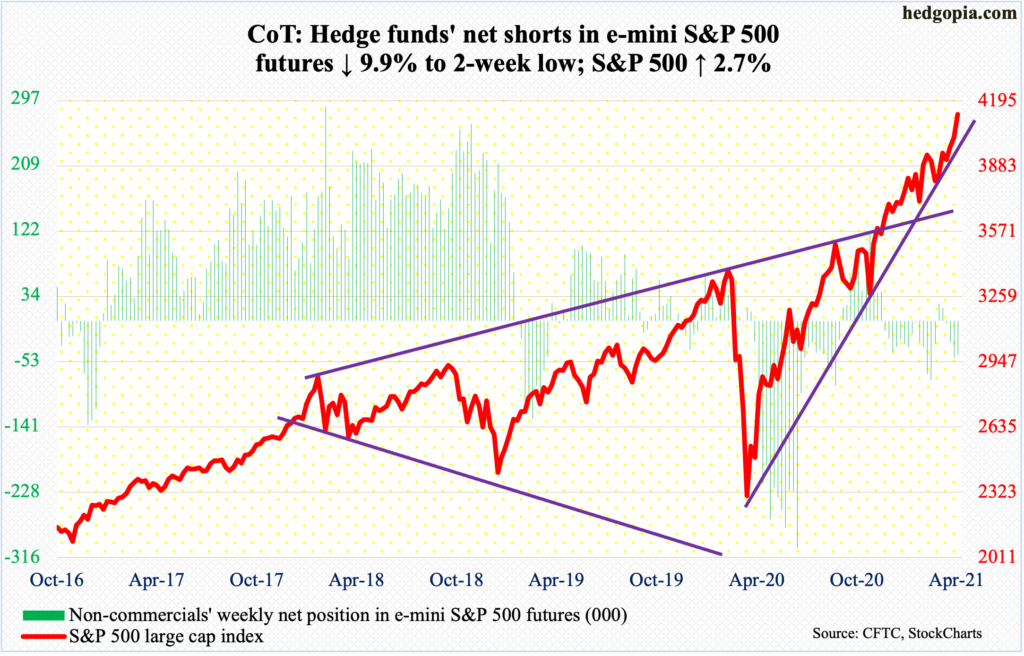
E-mini S&P 500: Currently net short 45.3k, down 5k.
US-based equity funds have now gained $105.2 billion uninterrupted in nine weeks, including $5.7 billion in the week to Wednesday (courtesy of Lipper). In the same week, SPY (SPDR S&P 500 ETF), VOO (Vanguard S&P 500 ETF) and IVV (iShares Core S&P 500 ETF) took in $571 million (courtesy of ETF.com).
The S&P 500 (4128.80) built on last Thursday’s breakout at 3980s (more on this here). On Thursday this week, the large cap index enjoyed another mini-breakout at 4080s. It has now rallied 7.1 percent from 11 sessions ago when the 50-day was successfully tested.
Nothing like price to change sentiment.
Investors Intelligence bulls in the week to Tuesday jumped 6.4 percentage points week-over-week to 60.8 percent – the first 60+ reading in 10 weeks. In the week to Wednesday, the NAAIM Exposure Index surged 37.8 points w/w to 89.9 – a seven-week high. And in the week to Thursday, AAII bulls climbed 11.1 percentage points w/w to 56.9 percent, which was the highest reading since January 2018. The three respectively measure sentiment among newsletter writers, money managers, and retail. Sentiment is beginning to get euphoric – again. Our own Hedgopia Risk Reward Index, which can be seen on our home page, is fast approaching the red zone.
Nearest support lies at 4080s and 3980s after that.
Euro: Currently net long 67.5k, down 6.2k.
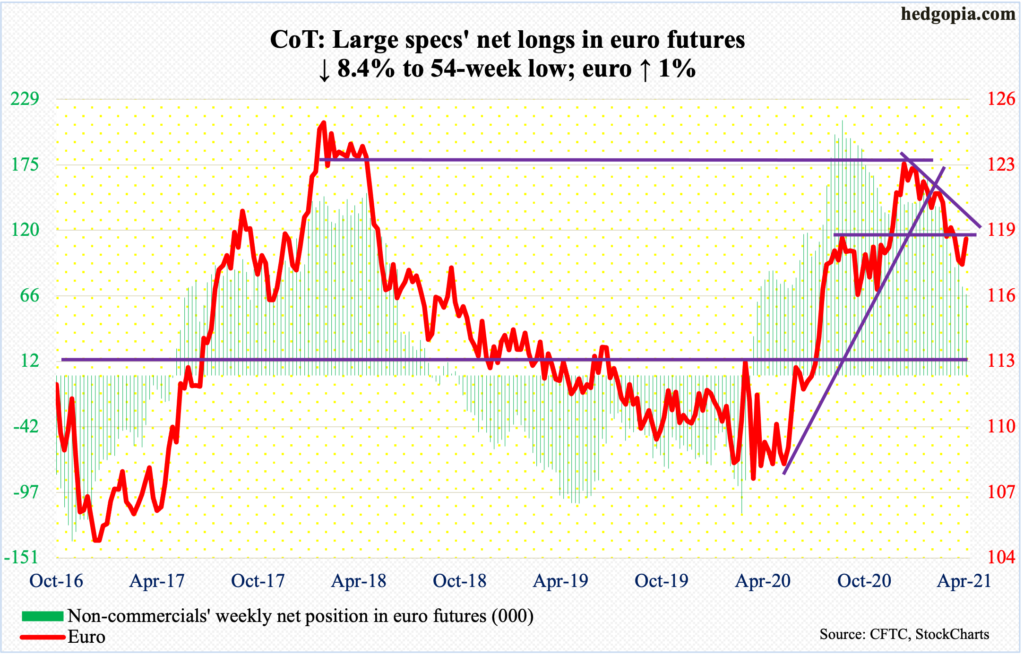
After last week’s weekly hammer, the euro ($1.19) rallied one percent this week. Earlier, between its high on January 6 ($1.2345) and the low on March 30 ($1.1712), the currency dropped 5.1 percent.
This week’s rally pushes the euro between the 50- and 200-day – $1.1978 and $1.1871 respectively. On Thursday, it tagged $1.1928 intraday before retreating. Resistance at $1.19-$1.20 goes back 18 years. This level was lost in the first week of March. Besides the 50-day, around $1.20 rests trend-line resistance from the January 6th high. Resistance is tough around here.
Gold: Currently net long 189.5k, up 22k.
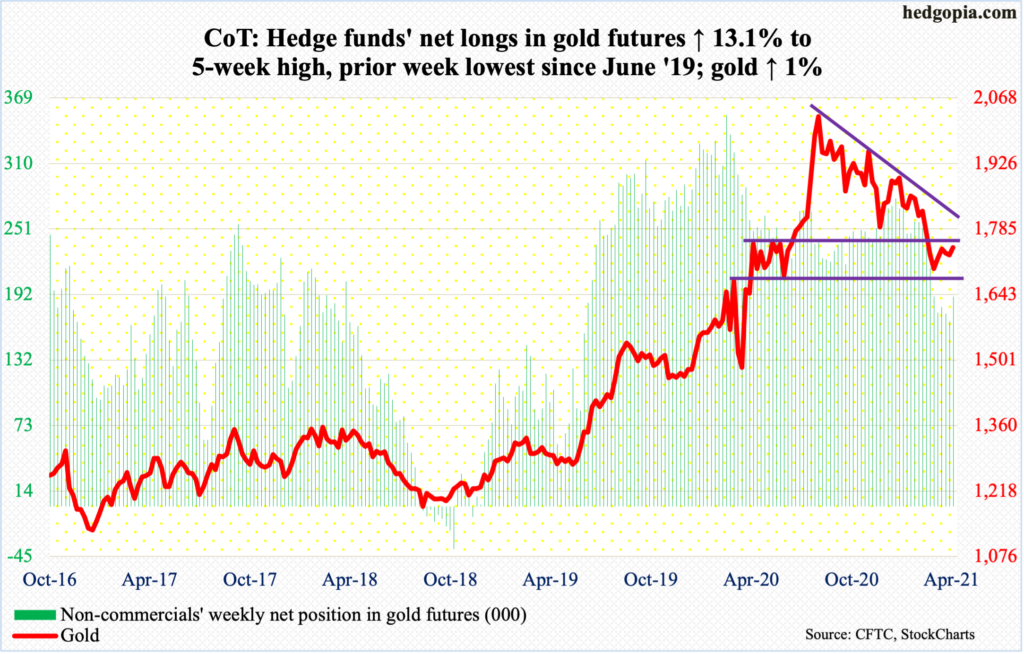
On both Tuesday and Wednesday last week, Gold tested $1,670s – successfully; the week ended with a weekly hammer. This level, which goes back a year, also held its ground a month ago.
Now comes the hard part. The 50-day rests at $1,760.80, which now approximates horizontal resistance at $1,760s-$1,770s. This support, which was part of a broken descending triangle, was lost at the end of February. Gold reached its all-time high of $2,089.20 on August 7 last year, followed by a series of lower highs.
On Thursday, the yellow metal ($1,744.80/ounce) did rise to $1,759.40, but only to retreat in the next session.
At this juncture, a little help from flows should go a long way. In the week to Wednesday, GLD (SPDR Gold ETF) lost another $464 million. In the last 25 weeks, 22 have seen outflows, for a cumulative loss of $14.3 billion (courtesy of ETF.com). Flows began to turn negative in the week to October 21 last year.
Also worth watching is if non-commercials begin to add to their net longs, which last week hit the lowest since June 2019. This week, they added 22k contracts.
Nasdaq 100 index (mini): Currently net short 9.4k, down 8.5k.
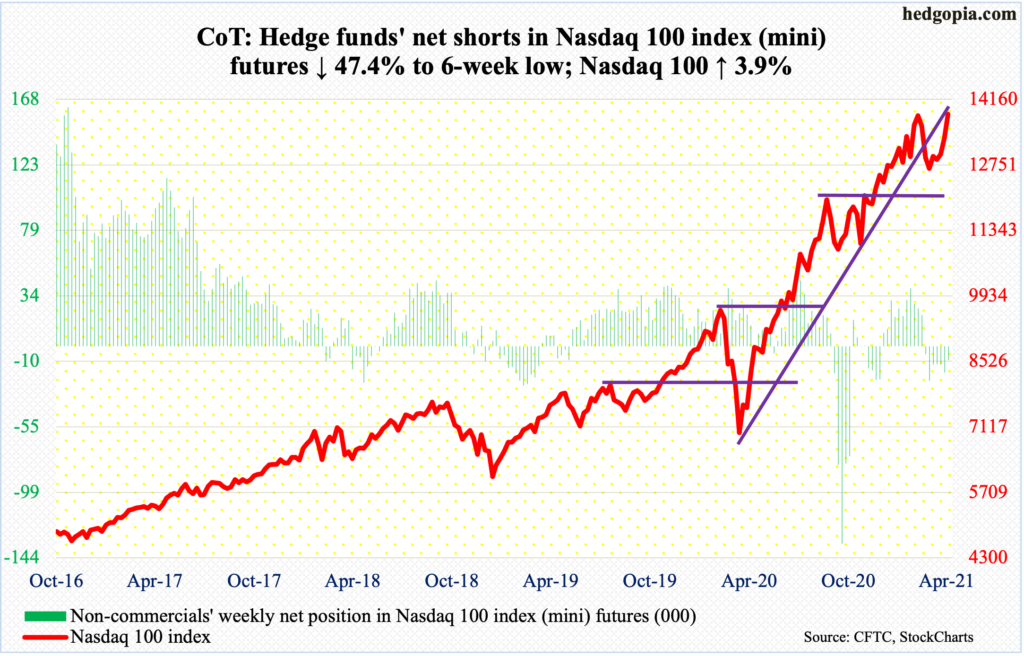
Last Thursday, the Nasdaq 100 gapped up to reclaim the 50-day, which it remained under for a month. On Monday (this week), the index gapped up again to fill a gap from February 22. Thursday, it gapped up again.
Suddenly, there is now a rush to own tech, which has otherwise lagged. Year-to-date, the S&P 500 is up 9.9 percent and the Nasdaq 100 7.4 percent. This even after this month’s outperformance by the Nasdaq 100, which is up 5.8 percent versus the S&P 500’s 3.9 percent.
With this, the Nasdaq 100 (13845.05) is merely 35 points from its all-time high of 13879.77 from February 16. The S&P 500 surpassed its from that date a long time ago. A drop in the 10-year treasury rate has likely helped tech (more on this here). Time will tell if the newfound love for the sector sustains – enough to negate the ominous-looking candles in the first three months. March formed a monthly dragonfly doji, February a shooting star and January a long-legged doji.
Russell 2000 mini-index: Currently net short 24.4k, up 14.4k.
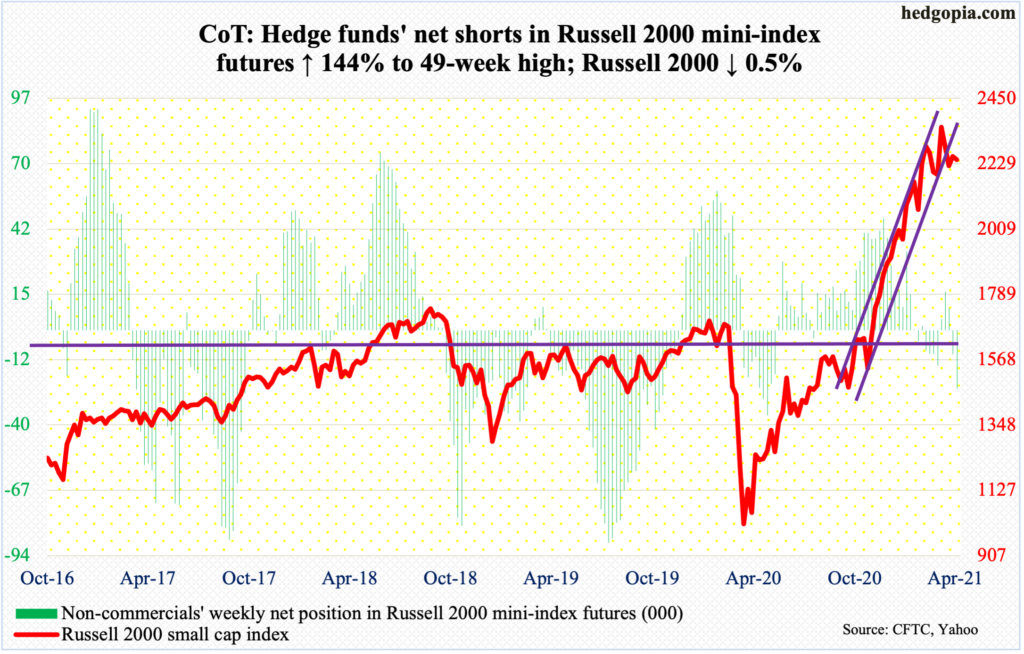
The Russell 2000 (2243.47) could be forming the right shoulder of a potentially bearish head-and-shoulders formation. The neckline lies at 2070s-2080s.
After a monstrous 144-percent rally from the low of March last year, the small cap index printed its all-time high of 2360.17 on March 15. In the selloff that followed, it lost a rising channel from October-November last year. March formed a monthly spinning top.
After the November 3 presidential election and particularly after Pfizer (PFE) announced its positive vaccine news, followed by Moderna’s (MRNA) a week after that, investors heavily gravitated toward small-caps at the expense of tech in particular.
It is possible this thesis is now played out. It is now common knowledge that the US economy is set to boom this year. This raises the odds that small-cap investors are beginning to lock in their gains. This week, the Russell 2000 shed 0.5 percent; in contrast, the S&P 500 rallied 2.7 percent and the Nasdaq 100 3.9 percent.
Non-commercials’ net shorts in Russell 2000 mini-index futures rose to a 49-week high.
The aforementioned neckline has taken on significance.
US Dollar Index: Currently net long 4.4k, down 1.3k.
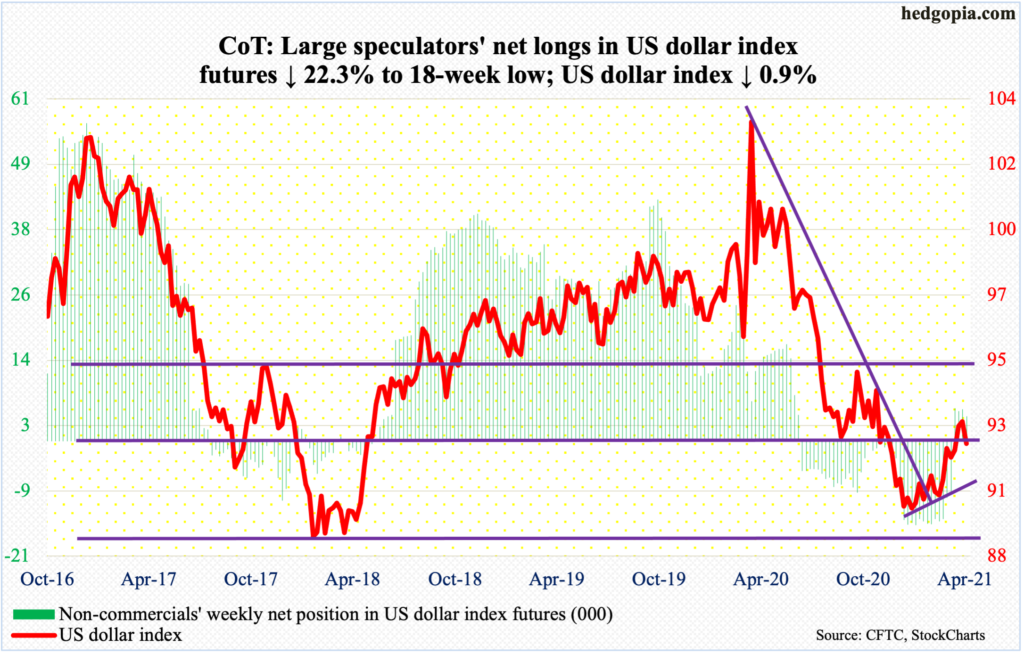
After remaining above the 200-day for six sessions, the average was breached on Monday. Earlier on Wednesday last week, the US dollar index (92.16) retreated after tagging a five-month high 93.47. Even earlier, it bottomed at 89.17 on January 6. Support at 88-89 goes back at least 17 years. In the subsequent rally, it was able to reclaim support-turned-resistance just north of 92, which has proven to be an important level going back 18 years and which was lost last November. This level is being tested – again. Odds favor a breach in the sessions ahead.
The 50-day lies at 91.49, and just under 91 extends a rising trend line from the aforementioned low three months ago. This will be an opportunity for dollar bulls to register another higher low.
VIX: Currently net short 87.6k, down 6.8k.
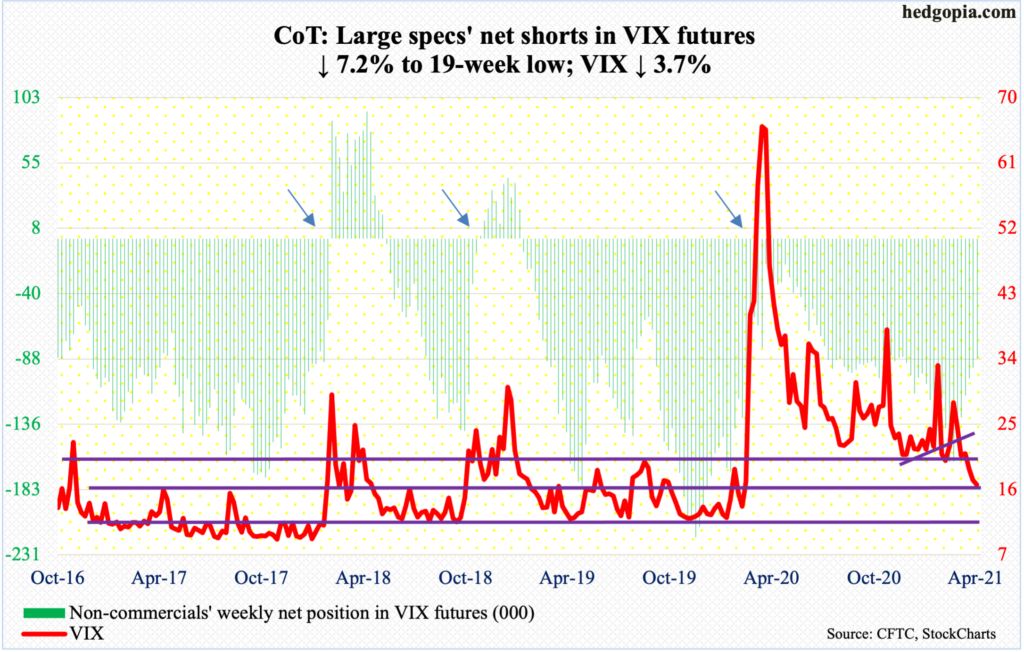
Last Thursday, VIX (16.69) breached 20, closing at 17.29. That low was handily undercut this week as the volatility index tagged 16.20 intraday Friday. Despite this, VIX arguably held up better this week considering the rally in the S&P 500. With that said, this is little consolidation for volatility bulls who have been on the back foot for a while now.
When stocks were in freefall in March last year, VIX rallied as high as 85.47. From that high, it progressively posted lower highs, even as low-20s was getting defended. This support is now gone. Before this could even be tested, there is now resistance at 17.30s and just under 19 after that.


