
Longest Bull In US Stocks Ended Last Month – Panicky Fed Cannot Afford End Of ‘Fed Put’
No one rang the bell when the longest bull in US stock market history came to an end last month. The drop was swift and decisive. Several oversold metrics are itching to get unwound. But markets are in panic mode. Fiscal help is coming in piecemeal. And the Fed itself is in panic mode, cutting the policy rate by 125 basis points in two weeks in as many emergency meetings. It cannot afford the end of the so-called ‘Fed put’.
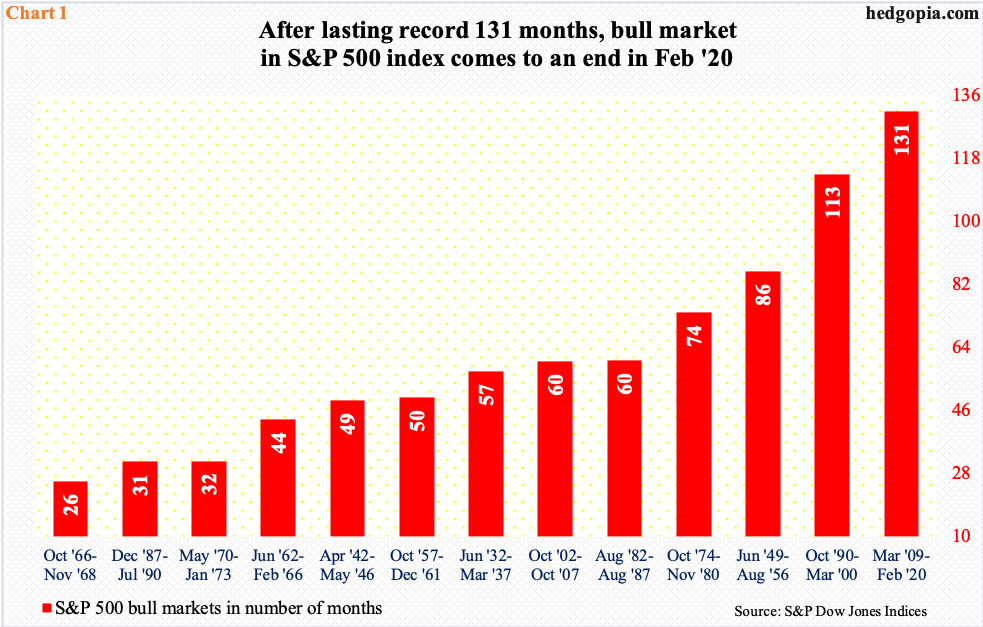
The longest bull market in US stocks is over – in a rather unexpected manner. As recently as February 19, the S&P 500 large-cap index (2711.02) reached a fresh intraday all-time high of 3393.52. In the next 16 sessions, that is by last Thursday, it crashed 27 percent. Market participants use 20 percent as the threshold to decide if a bull or bear market has begun. This includes S&P Dow Jones Indices whose data is used in Chart 1.
The latest bull began on March 9, 2009, and ended on February 19 this year, lasting 131 months. The previous high was 113 months, which lasted between October 11, 1990, and March 24, 2000. In the 13 bull markets going back to the 1930s, these are the only ones exceeding 100 months. In fact, nine of them lasted five years or less.
The curtain was brought down in a swift and decisive manner. The S&P 500 rallied 401 percent during the nearly-11-year-old bull – second only to the 417-percent jump in the 1990s – so longs did not want to wait around and wonder what is next. Due to the coronavirus and the associated disruptions to the global supply chain and the daily lives, the threat of a global recession is real. A large number of investors have accordingly rerated their outlook.
The sell-side in the US is yet to do so. These analysts are notorious for starting out in an overly optimistic manner and revise estimates lower as the year progresses. For last year, operating earnings estimates for S&P 500 companies were $177.13 in August 2018. When it was all said and done, 2019 brought home $157.11. This year, a year ago these companies were expected to ring up $186.36, which as of last Thursday was cut down to $169.94, which will still register growth of 8.2 percent. Investors who pushed the ‘sell’ button the last four weeks lack conviction in either these numbers or the valuation multiples derived thereof.
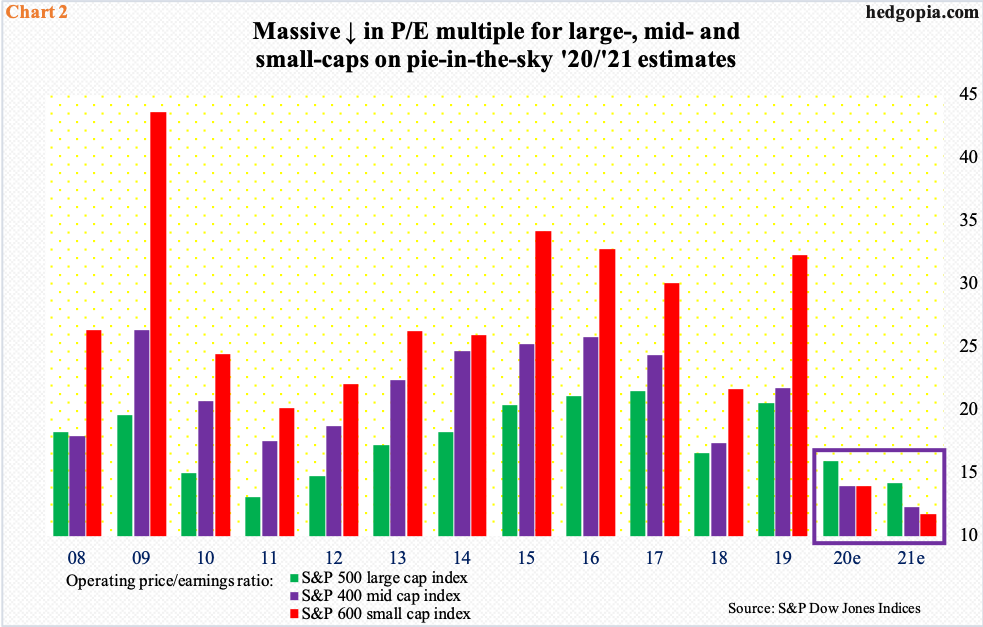
Chart 2 plots the operating P/E ratio for S&P 500, 400 (mid-cap) and 600 (small cap) companies. Forward multiples have taken a nosedive (box). This is not because of improvement in the denominator (earnings), rather a big drop in the numerator (stocks). Rerating of earnings estimates is yet to come, which might begin next month as companies begin reporting 1Q earnings.
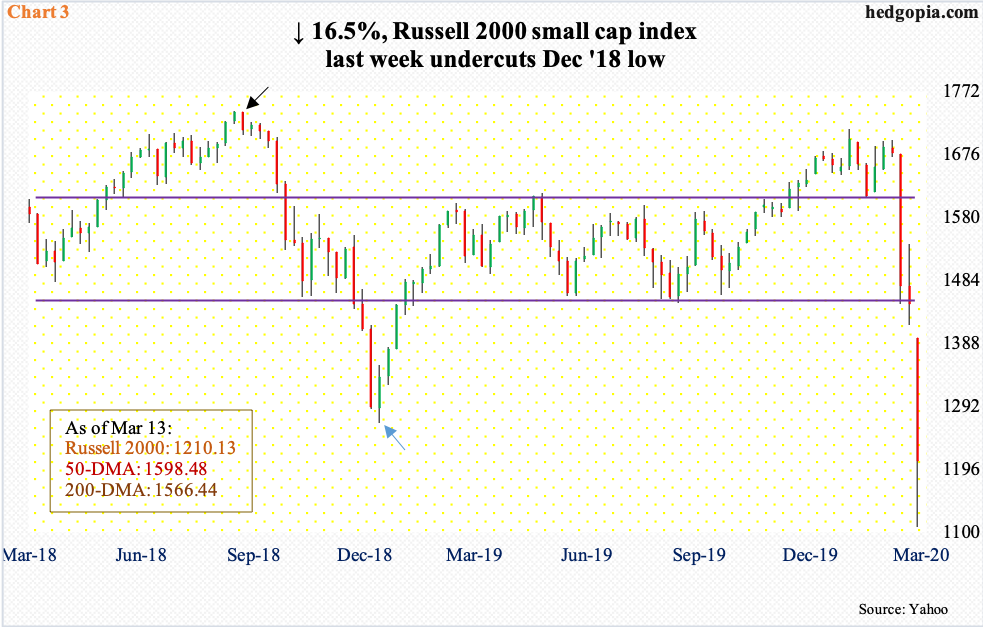
From this perspective, what is transpiring in small-caps is worthy of attention.
The Russell 2000 small-cap index, as well as the S&P 600 small-cap index, peaked as far back as August 2018 (black arrow in Chart 3). Large-caps, on the other hand, kept rallying to new highs. Small-caps, which investors generally tend to gravitate toward in a risk-on environment, diverged. Fast forward to the present, and it is easy to see why. Earnings have been a disappointed – big time.
In 2019, S&P 600 companies earned $31.66, substantially less than the $39.05 they brought home in 2018. Rather curiously, in June 2018 the sell-side expected these companies to earn $61.63 last year. This year, they are at it again, modeling in $52.07. The way small-caps are reacting, investors do not have the least bit of conviction in these estimates. They are probably right.
The Russell 2000 (1210.13) last week collapsed 16.5 percent. In merely 16 sessions through last Thursday’s intraday low, the index crashed 34 percent – mush worse than its large-cap peers. In the process, it not only lost 1600+ but also 1450s, not to mention the December 2018 low (blue arrow). Amid severely oversold conditions, last Friday’s intraday reversal is a step in the right direction. Immediately ahead, bulls and bears are likely to lock horns in the 1265 area.
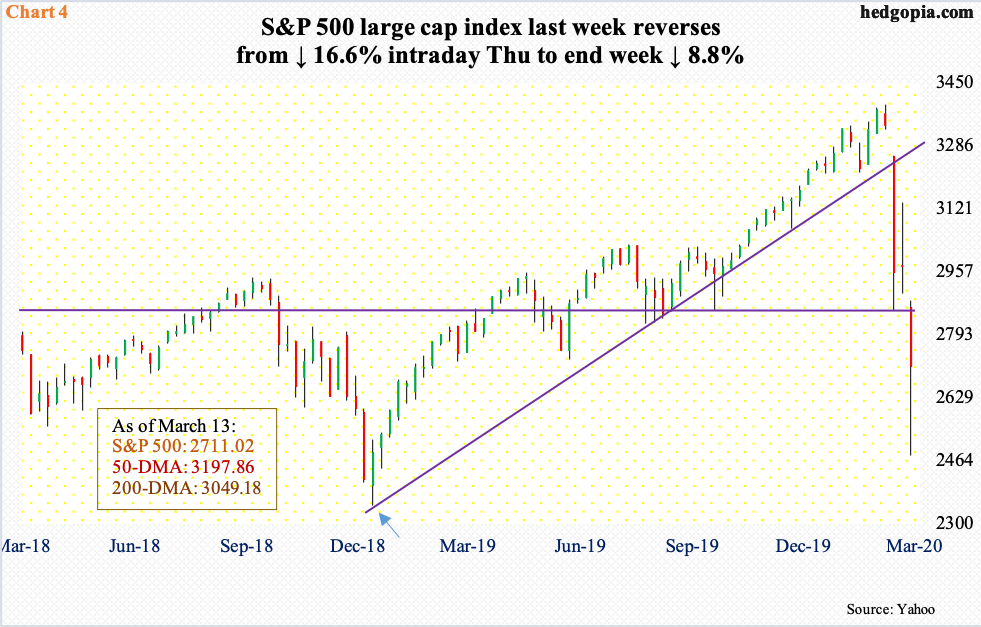
In more ways than one, large-caps are simply catching up with the forewarnings from small-caps that lasted for months. At last Thursday’s intraday low, the S&P 500 lost in 16 sessions what it took 14 months to build. As a consolation, the December 2018 low remained intact in that session. That was an important low (Chart 4).
But the index has suffered substantial technical damage. Support levels fell one after another. Amidst this carnage came last Friday’s hammer reversal. As long as 2500 is not breached, odds favor bulls right here and now – if nothing else just to unwind oversold conditions. They will have significantly improved their odds should they recapture 2850s. A breach of last week’s lows can open the door to a test of 2100 support.
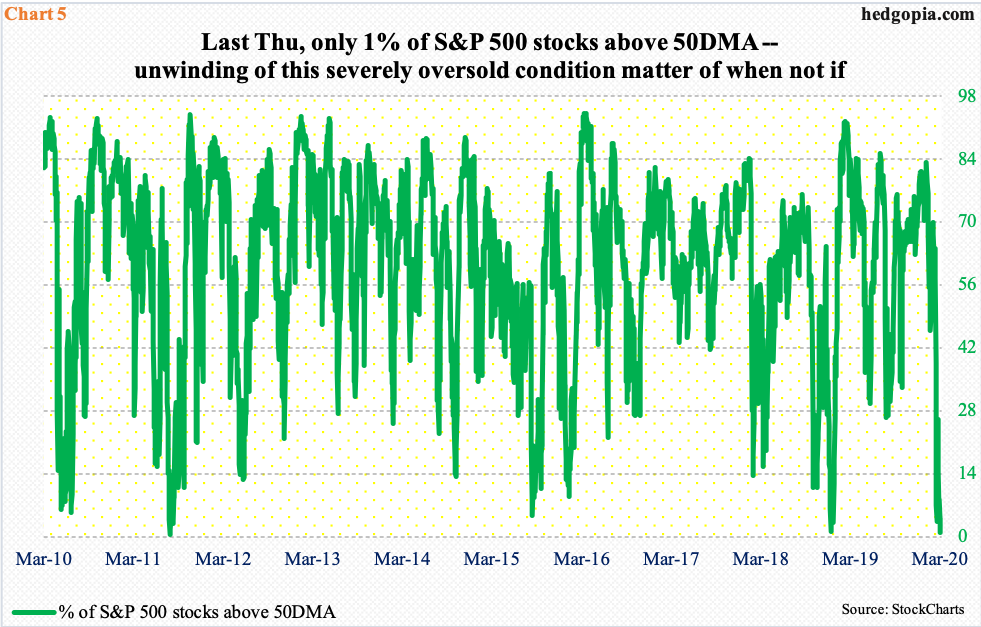
Several oversold – some of them completely washed out – metrics now await unwinding.
Last Thursday, merely one percent of S&P 500 stocks were above their 50-day moving average. This is lower than the 1.2 percent recorded on Christmas Eve 2018 (Chart 5). This is washout territory.
Interestingly, mid-January this year, this metric stood in the low 80s. Optimism ruled back then. Now, the pendulum has swung the other way. Unwinding is a matter of when not if.
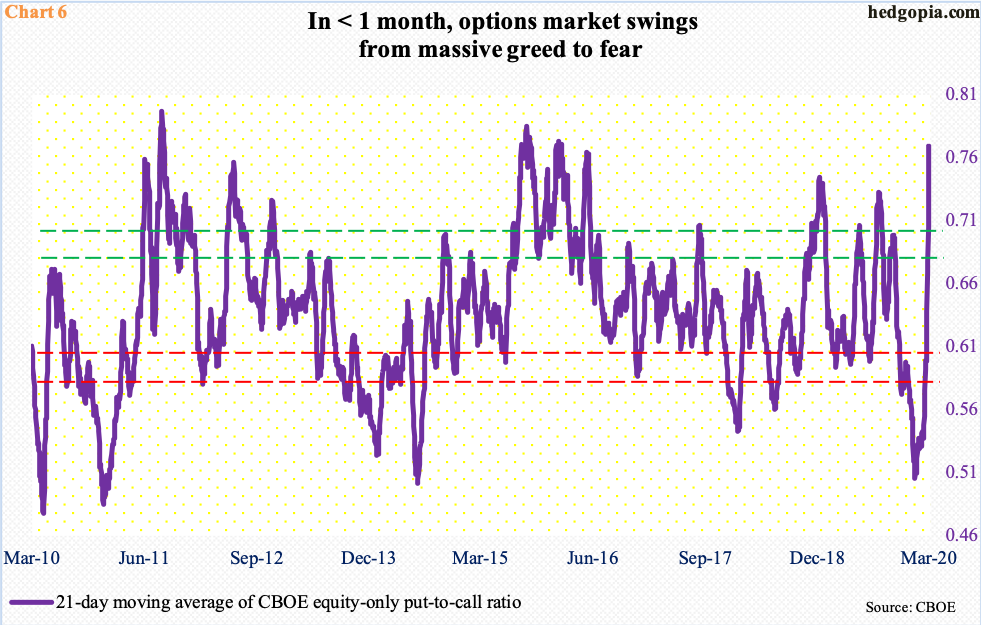
There is a similar message coming out of the options market.
Once again, mid-January, the 21-day moving average of the CBOE equity-only put-to-call ratio dropped to 0.506, which was the lowest since July 2014. Greed ruled back then. Then came the selloff in equities. Sentiment did a quick U-turn. In four of the five sessions last week, the ratio posted one or higher. Fear is palpable in the air. As a result, the 21-day average ended the week at 0.767 – a four-plus-year high (Chart 6). In due course, this will get unwound.
Besides several oversold indicators, one possible reason why stocks strongly reversed higher last Friday is this week’s FOMC meeting plus hopes for fiscal stimulus.
Late Friday last week, the House pushed through an economic stimulus measure, which is expected to be passed in the Senate and signed by the President this week. It does not have the billions of markets probably thought was forthcoming.
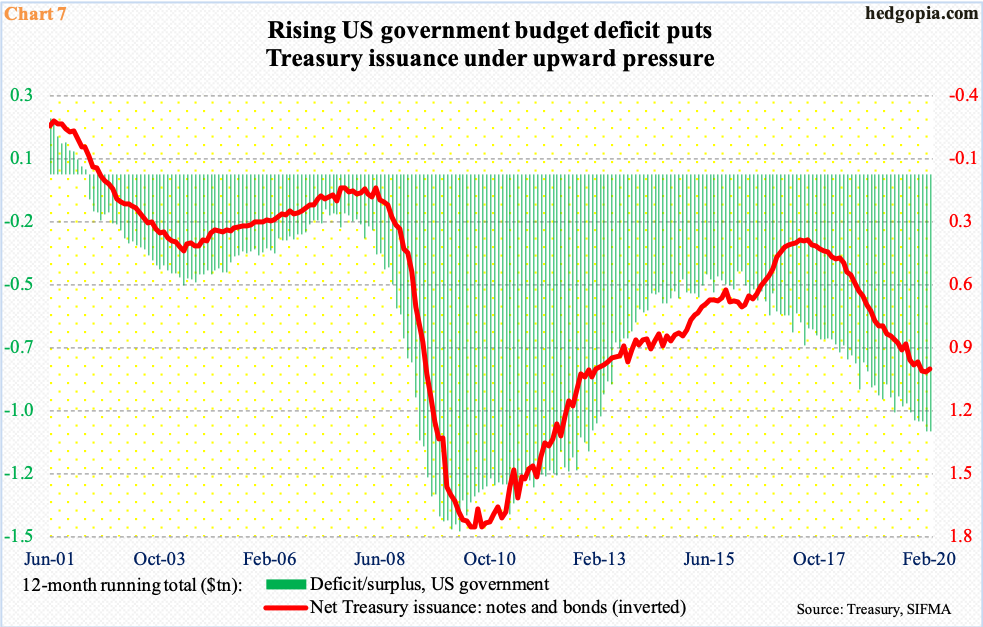
It is an election year. Democrats and Republicans will likely grow further apart on top priorities for government. Besides, the federal budget deficit is already north of $1 trillion. In the 12 months to February, the red ink was $1.06 trillion and issuance of Treasury notes and bonds $949 billion (Chart 7). This likely limits the chances for massive fiscal help.
Then, Sunday evening, the Fed acted again. It cut the fed funds rate by a full percentage point and said it would buy $700 billion worth of Treasury and mortgage-backed securities. In two weeks, the policy rate has been cut by 125 basis points in two emergency meetings, to essentially zero-bound. QE4 is on. But unlike in the past, markets went into panic mode. At the time of this writing, S&P 500 futures were limit down 4.8 percent. The Fed genuinely hopes this weakness gets bought as the cash opens later this morning. Else, this will have all but amounted to the end of the ‘Fed put’. We are then talking uncharted territory.


