
Long And Short Of Short Interest
Here is a brief review of period-over-period change in short interest in the April 1-13 period in nine S&P 500 sectors.
XLB (SPDR materials ETF)
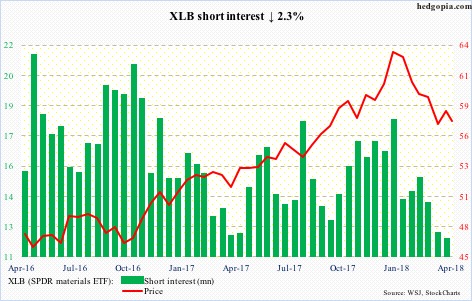
On Wednesday last week, XLB (57.24) tested a falling trend line from January 26 when it rose to the all-time high of 64.17 and was rejected. This was subsequently followed by the loss this week of the 50-day moving average and, most importantly, the 200-day.
Recent lows of just north of 55 are likely in play, which is where the daily lower Bollinger band lies.
XLE (SPDR energy ETF)
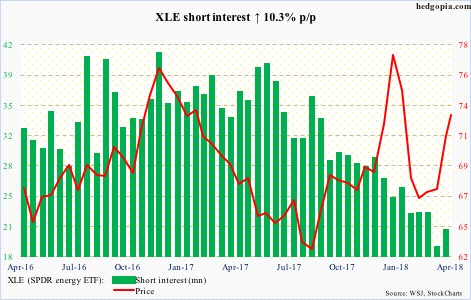
After breaking out two weeks ago of two-month congestion between 66.60 and 68.70, XLE (72.96) through Tuesday’s intraday high quickly jumped 10 percent. Short interest was already so low squeeze probably did not play a role in this. Shorts rather added a tad.
The daily chart is way overbought. The bears would love breakout retest, but before that they have to take out support at 72.
XLF (SPDR financial ETF)
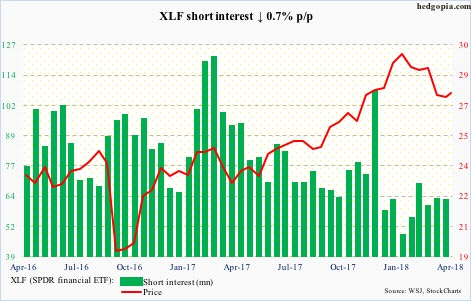
Adverse post-earnings reaction eight sessions ago to results from some of the major US banks was a big tell. XLF (27.67) ended with a big bearish engulfing candle in that session. The ETF continues to remain under the 50-day. This is coming at a time when rates across the curve have rallied. The 200-day rests at 26.96. A test – once again – looks imminent.
XLI (SPDR industrial ETF)
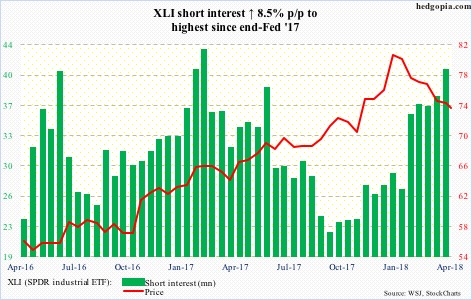
A week ago, rally attempts were denied north of 76. Tuesday this week, XLI (73.40) sliced through the 50-day, even as the 200-day was lost intraday but saved by close. Shorts have gotten very aggressive the past couple of months, and will be rewarded even more should the ETF lose support at 72-72.50. As things stand, it is the bears’ ball to lose.
XLK (SPDR technology ETF)
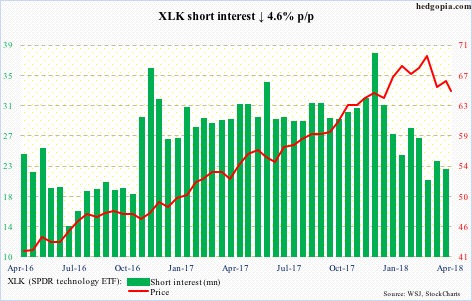
Late last year and early this year, XLK (64.82) shorts got squeezed – big time. That tailwind is substantially less, if not gone entirely.
Last Friday, the ETF lost the 50-day, followed Tuesday by a test of a rising trend line from the February 9 low. Should this give way, the 200-day lies at 62.90. The average has not been lost since June 2016, and would be a major development should it crack.
XLP (SPDR consumer stables ETF)
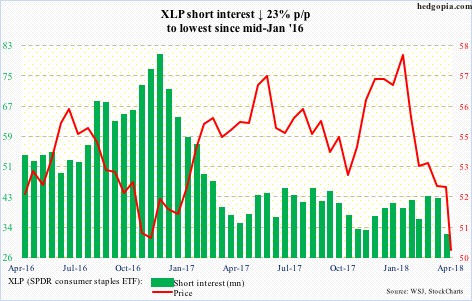
Broken support-turned-resistance/50-day was tested last week – unsuccessfully. This week, XLP (50.11) made another low – lower than prior lows from February 9 and March 23.
Interestingly, shorts probably were not expecting the latest breakdown that began five sessions ago. Prior to this, short interest was cut to the lowest since mid-January 2016.
XLU (SPDR utilities ETF)
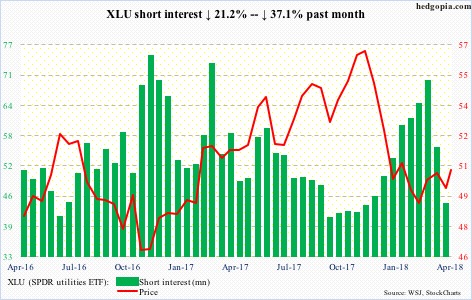
XLU (50.67) has been trading within a rising channel from early February, managing to rally to 51.96 and test the upper bound last Wednesday. Interest rates backed up this month, but the ETF essentially went sideways. The 50-day is curling up. All good, except short interest went down big without providing much of a tailwind.
XLV (SPDR healthcare ETF)
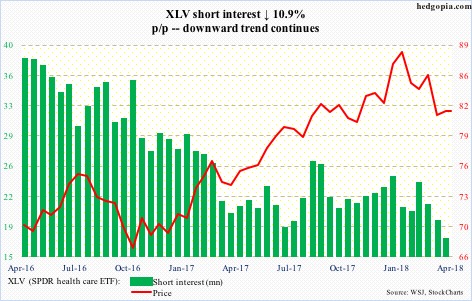
Shorts’ disinterest continues. Even without this selling, XLV (81.79) has not gotten its groove back since peaking at 91.79 on January 29. The pattern of lower highs continues. Once again, it is back below both the 50- and 200-day. Nearest support lies at 79.50-ish, which is approximated by the daily lower Bollinger band.
XLY (SPDR consumer discretionary ETF)
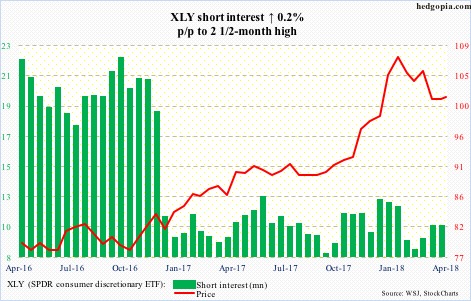
XLY (101.57) short interest has more or less gone sideways for 16 months now. During this, it rallied a ton, but also reached a potentially important high late January, with lower highs since. From the bulls’ perspective, there is support at 100, and 97 after that.
Disclaimer: This article is not intended to be, nor shall it be construed as, investment advice. Neither the information nor any opinion expressed here constitutes an offer to buy or sell any ...
more

