
Long And Short Of Short Interest - Wednesday, March 27
Here is a brief review of period-over-period change in short interest in the Mar 1-15 period in 10 S&P 500 sectors.
XLB (SPDR materials ETF)
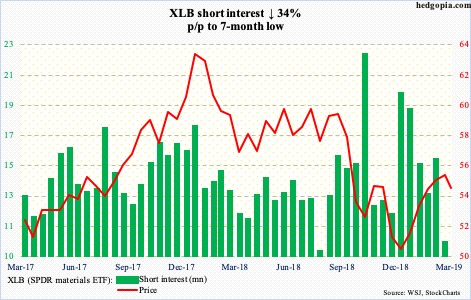
XLB (54.56) short interest fell to a seven-month low. Shorts probably feared a breakout at 56. This resistance goes back to July 2017. Bulls hammered on that ceiling for a month but were rejected. The 200-day moving average (55.73) lies around there as well. In all of the last three sessions, the 50-day (54.25) was tested. A break opens the door for a test of 52-53.
XLE (SPDR energy ETF)
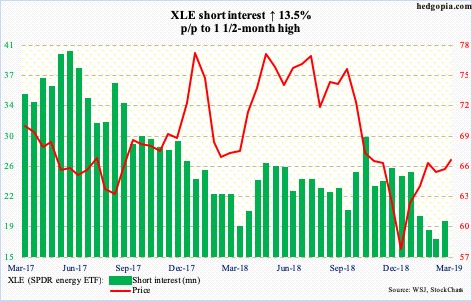
XLE (66.44) has tried to take out 67 for over a month now, but no success. This price level is right between the 50- and 200-day. The former was tested on Monday – successfully. Amidst this rather sideways move, the daily Bollinger bands have narrowed quite a bit, which often tends to precede a sharp move – either up or down.
XLF (SPDR financial ETF)
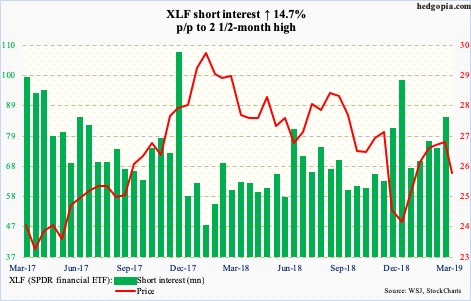
Early last week, XLF (25.53) rallied strongly to 27.10, past its 200-day but the momentum reversed quickly. By Monday (this week), it dropped to 25.08, which was defended. This is major support. The daily is getting oversold. Should a rally ensue, bulls likely will face resistance at the 50-day, which was lost last week.
XLI (SPDR industrial ETF)
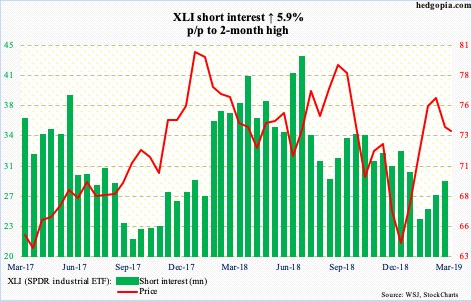
Since once again getting denied at 77-plus early this month, XLI (73.61) has come under pressure. Shorts have been adding, although not a whole lot. They probably will get aggressive should the ETF lose 73. Both the 50- and 200-day rest there – 73.29 and 73.19, in that order.
XLK (SPDR technology ETF)
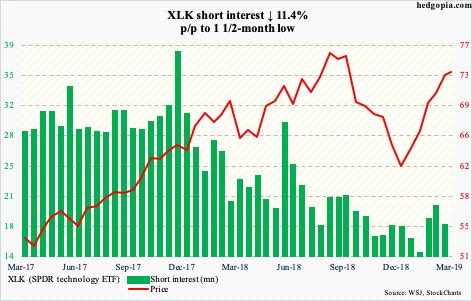
Last Thursday, XLK (73.40) came within 1.3 percent of last October’s all-time high of 76.26 but the week ended up with a gravestone doji. The weekly in particular remains grossly overbought. Near term, there is decent support at 71, followed by the 200-day (69.85). The 50-day (69.12) is right below.
XLP (SPDR consumer staples ETF)
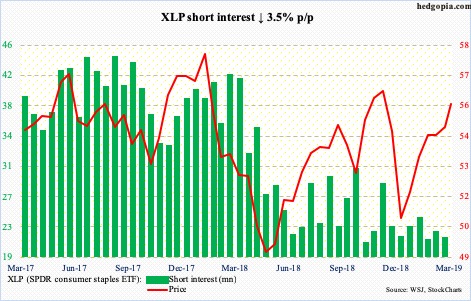
A rising trend line from late December was defended last Thursday on XLP (55.66). Shorts continue to lie low. That trend line now gets tested around 54.75, which approximates short-term horizontal support. The next area of interest is 56, which is where trend-line resistance from early January last year rests.
XLRE (SPDR real estate ETF)
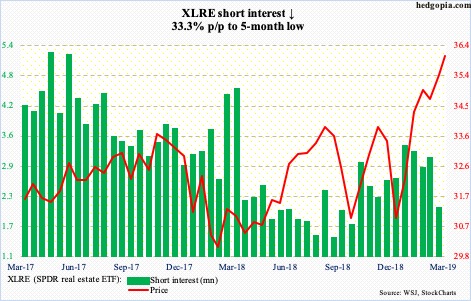
For more than two and a half years, XLRE (36.05) went back and forth within a rectangle, with the upper bound just south of 35. It broke out this month. Recent downward pressure on interest rates helped. Time will tell if it is a genuine breakout. If it is, technicians in due course would be eyeing 40. For now, a retest likely lies ahead. The daily is extended. Last Friday’s all-time high of 36.31 came in a shooting star session.
XLU (SPDR utilities ETF)
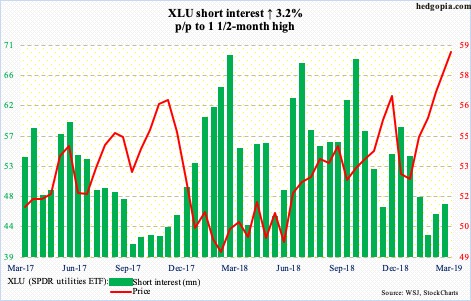
Bond proxies are having a field day. Early this month, XLU (58.96) busted through major resistance just north of 57, followed by a successful retest two weeks later. Shorts added in the past month, but nothing major. As overbought as the ETF is, so long as bulls continue to defend the breakout, bears have their backs against the wall.
XLV (SPDR healthcare ETF)
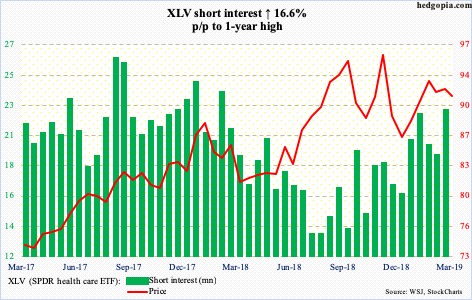
Early December last year, XLV (91.19) tried to rally past last October’s all-time high of 96.06 but failed. The selling that followed bottomed at 80.61 post-Christmas. All along, shorts have added. They may be onto something. The ETF last Tuesday made a lower high. It is barely above the 50- and 200-day (90.73 and 89.87, respectively). The latter was tested Monday.
XLY (SPDR consumer discretionary ETF)
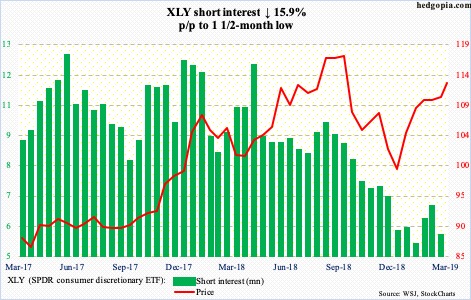
Resistance at 112 was conquered last week, albeit rather unconvincingly. XLY (112.81) continues to hover around that level. In the past several sessions, the ETF has met resistance at the daily upper Bollinger band. Bears will have to push the price below both the 50- and 200-day (109.11 and 109.41, respectively) to begin to get traction.


