
Long And Short Of Short Interest – Thursday, Dec. 27
Here is a brief review of period-over-period change in short interest in the December 3-14 period in nine S&P 500 sectors.
XLB (SPDR materials ETF)
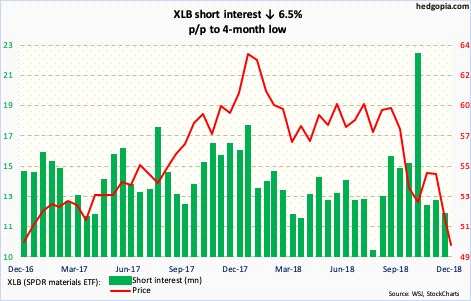
XLB (49.46) dropped to 47.05 intraday Wednesday before reversing to end the session up 4.5 percent. If it holds, this will represent breakout retest of 47-48 from two years ago. Odds favor continued rally at least near term. Immediately ahead, resistance lies just north of 50.
XLE (SPDR energy ETF)
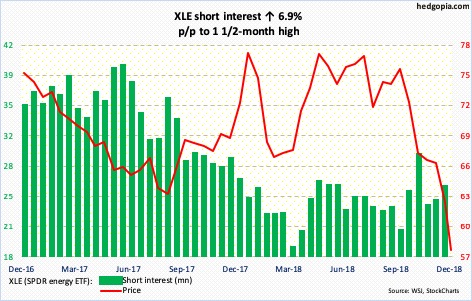
With two sessions to go in the week and thanks to Wednesday’s 6.2-percent jump, XLE (57.19) has hammered out quite a bullish hammer candle. Weekly and daily charts, in particular, are in deep oversold territory. If bulls had their way, they would love to test 62, and 64-plus after that.
XLF (SPDR financial ETF)
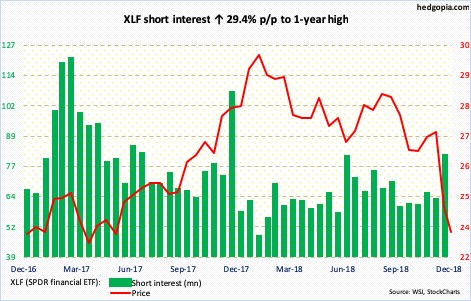
With wind at their back, XLF (23.32) shorts took short interest to a one-year high mid-December. At least some of Wednesday’s 4.5-percent jump in the ETF possibly owes to short-covering. This can continue. Bulls defended support at 22, and are probably eyeing 25, which in September last year XLF broke out of. If it manages to get there, shorts likely get active.
XLI (SPDR industrial ETF)
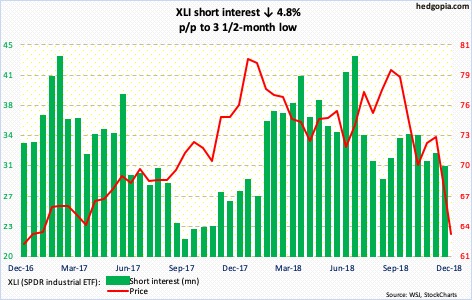
XLI (63.15) dropped out of a months-long rectangle in October. A measured-move target of that breakdown lied at 62-63. The ETF went on to undercut that level intraday Wednesday, but the session also produced a reversal candle. Nearest resistance lies at 67-68.
XLK (SPDR technology ETF)
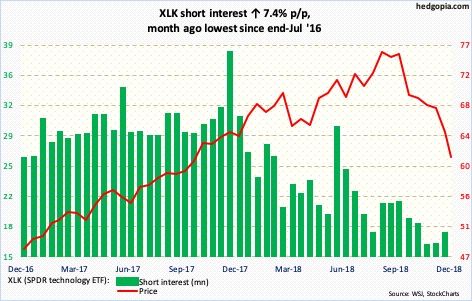
Mid-December, XLK (61.10) shorts added a tad but from a suppressed level. The ETF began to sell off early October. The weakness was not due to shorts pressing. From end-September, short interest is down 17 percent. This also means a lack of potential fuel for squeeze. For now, nearest resistance lies just north of 63.
XLP (SPDR consumer staples ETF)
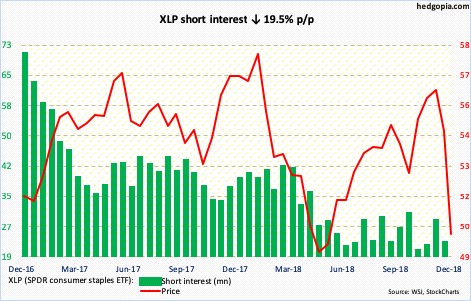
XLP (50.09) only began to seriously come under pressure early this month. Mid-month, it lost 55-55.50, which for nearly two and a half years acted like a magnet. Bulls now need to save 50, which is where the neck of a head-and-shoulders formation rests. Near-term, resistance lies at 52.
XLU (SPDR utilities ETF)
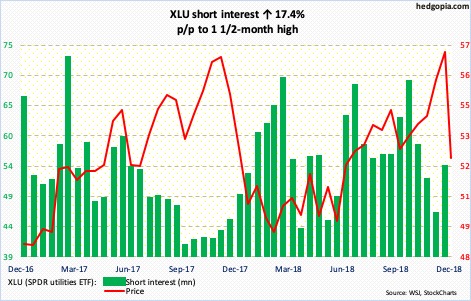
On December 10, XLU (52.26) came within seven cents of surpassing its all-time high of 57.23 from November 2017, but bulls could not pull it off. Then came the quick dive. By Wednesday, it dropped to 50.81 intraday, closing right near horizontal resistance. The 200-day moving average (52.41) lies right there.
XLV (SPDR healthcare ETF)
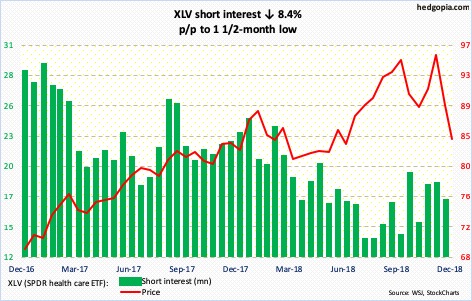
On December 4, XLV (84.22) came within 15 cents of surpassing its all-time high of 96.06 that was hit on October 1. That turned out to be quite an unsuccessful test. Wednesday, it hit an intraday low of 80.61. Near term, how things evolve just north of 86 will be a tell. The 200-day is at 87.60.
XLY (SPDR consumer discretionary ETF)
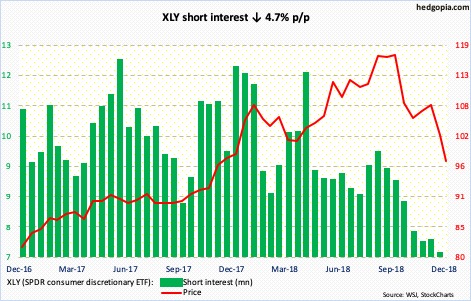
Shorts continued to cut back. XLY (97.43) fell 5.2 percent during the reporting period. Shorts locked in profit. In the current period, the ETF dropped even more. Bulls have a shot at 101-102. Should things evolve this way near term, short interest can drop further. It is merely 7.1 million currently.
Disclaimer: This article is not intended to be, nor shall it be construed as, investment advice. Neither the information nor any opinion expressed here constitutes an offer to buy or sell any ...
more

