
Latest Trump Blurb Leads To Engulfing Candlestick Pattern
Is The Trade War Between USA and China Back on?
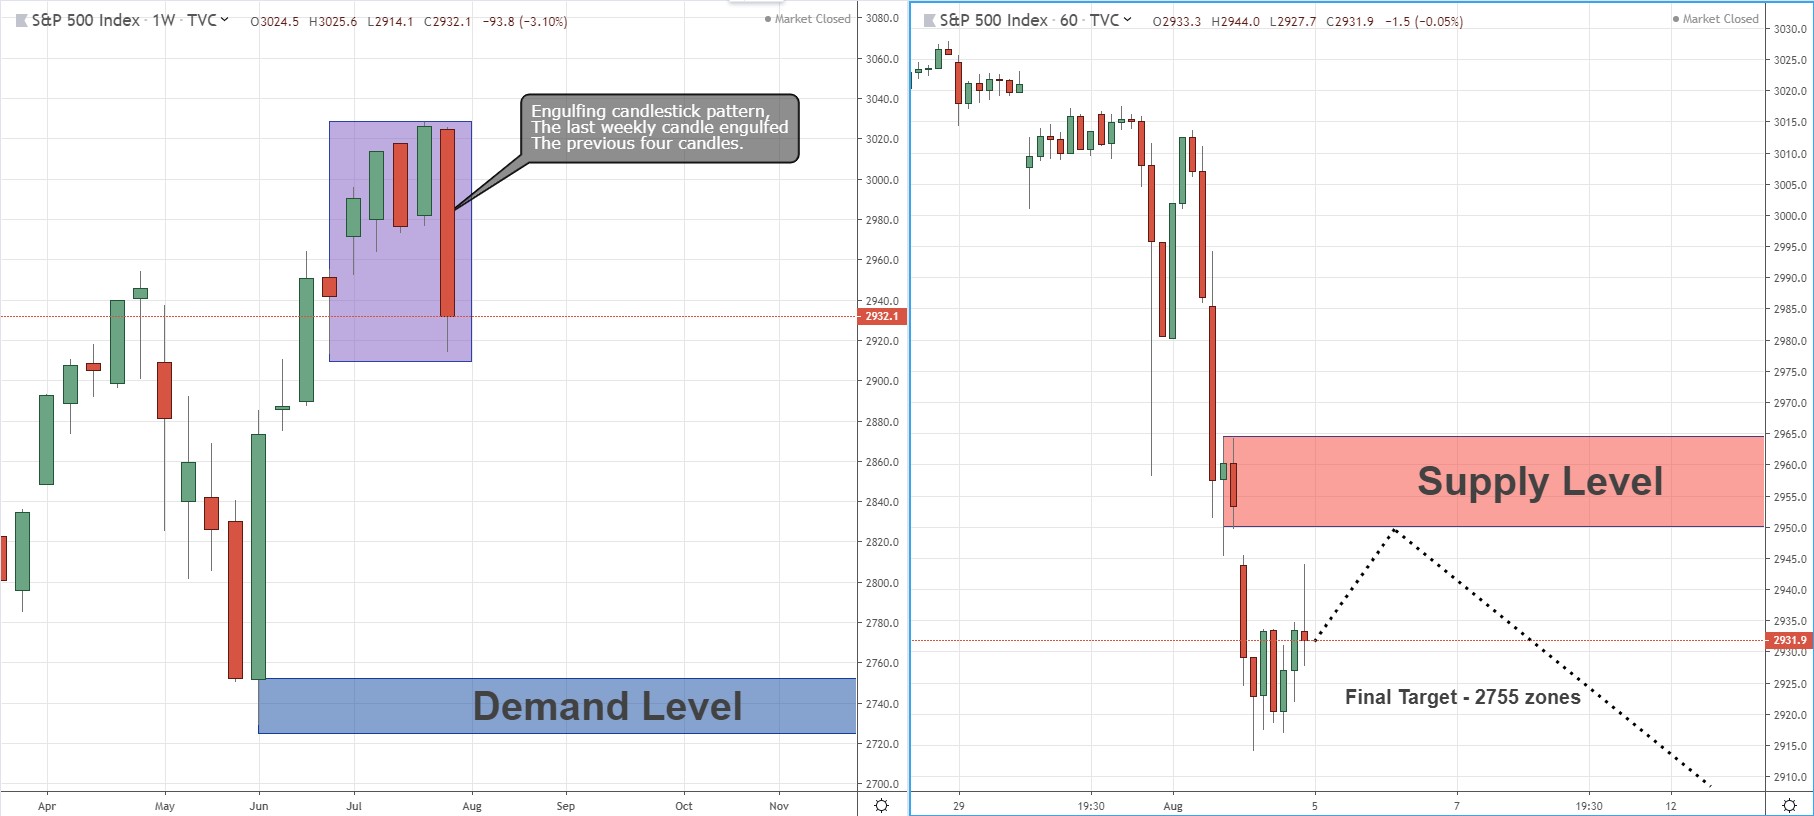
The last week’s candlestick for the SPX500 index has ended as a bearish reversal engulfing candlestick pattern.
The big red candle of the last week engulfed the previous four weekly candles and closed below these four candle’s low.
It seems like it’s the implications of Donald Trump’s latest remarks about tariffs.
A few weeks ago, in one of our previous posts on SPX500, it was good news for the stock market after the meeting between Trump and Xi Jinping.
Trump tweets: “Things look very good” and the markets rise up.
A few days ago things sound different as Trump announced on an additional 10% tariff rate for all Chinese goods.
Now, eyes focus on Beijing to see how they will react to the latest escalation.
Technically, the bearish reversal engulfing candlestick creates a signal and opportunity for sell position on SPX500.
In the H1 time frame, we can see how the market opens Friday with a Gap down.
This Gap down is also a fresh supply as the price dropped from there.
If the price will close that Gap and touch the supply above it will be great timing to open a sell position.
The final target for the sell position will be the demand below that marked on the W1 picture.
This demand is also a potential level for buy position.
We can how this demand creates 8 weeks ago a bullish outside bar candlestick pattern.


