
Latest Commitment Of Traders, Future Positions Of Non-Commercials
Following futures positions of non-commercials are as of June 22, 2021.
10-year note: Currently net short 2.3k, up 36.6k.
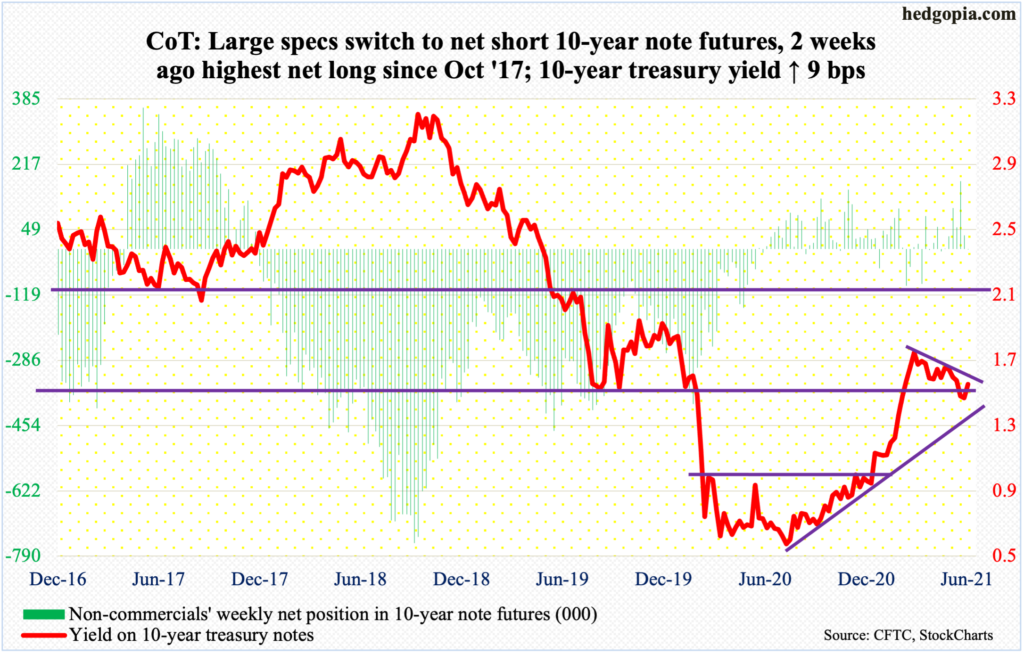
Doves have won – for now.
In the wake of a slightly hawkish tilt in last week’s FOMC meeting in which members brought forward their projections for interest rate hikes into 2023, with 11 of them penciling in at least two quarter-point increases that year, repercussions were felt across assets. The immediate post-meeting reaction was to sell stocks, sell bonds, buy the dollar and sell gold, among others.
As this week opened, both doves and hawks got to work.
Fed Chair Jerome Powell and John Williams, president of the New York Fed which has a permanent voting seat, argue that it was too soon to dial back the ongoing monetary stimulus. Presidents Robert Kaplan, James Bullard and Raphael Bostic – Texas, St. Louis and Atlanta districts respectively – argue that the time to pare back the bond-buying program is growing closer. Bostic sees a rate liftoff next year.
The fed funds rate is currently zero-bound, even as the Fed spends up to $120 billion a month in bond purchases – $80 billion in treasury notes and bonds and $40 billion in mortgage-backed securities. The balance sheet has grown from $4.2 trillion in early March last year to $8.1 trillion as of Wednesday this week.
Stocks are hooked on this monetary morphine. The way bulls see it, there is no end to this – at least not now. Of the three hawks above, Bostic is a voting member this year, but will not vote next year. Bullard becomes a voting member next year and Kaplan the year after. This week, both the S&P 500 and Nasdaq 100 rallied north of two percent to fresh highs. The Fed put is well entrenched (more on this here).
This round goes to the doves.
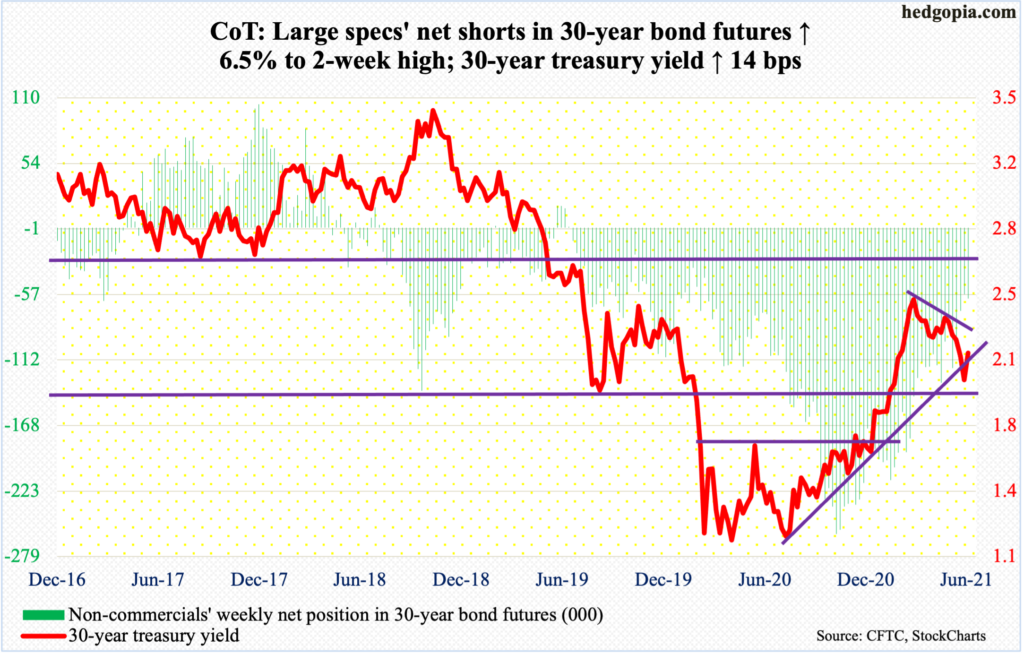
30-year bond: Currently net short 60.4k, up 3.7k.
Major economic releases for next week are as follows.
On Tuesday, the S&P Case-Shiller Home Price Index (April) comes out. Nationally, US home prices in March jumped 13.2 percent year-over-year. This was the fastest pace of y/y appreciation since December 2005. The median price of both new and existing homes posted new records in May (chart here).
The ISM manufacturing index (June) will be published on Wednesday. Manufacturing activity rose 0.5 points month-over-month in June to 61.2. The index has remained above 60 for four months in a row – and in five of the last six months.
Friday brings the employment report (June) and durable goods orders (May, revised).
In May, the economy created 559,000 non-farm jobs, for a monthly average this year of 478,000. Since the post-pandemic low of April 2020, 14.7 million jobs have been created. However, from the February 2020 record high of 152.5 million, there are still 7.6 million fewer people working.
Preliminarily in May, orders for non-defense capital goods ex-aircraft – proxy for business capex plans – jumped 22.7 percent y/y to a seasonally adjusted annual rate of $75.2 billion. Last year, April saw the post-pandemic low of $59.9 billion.
WTI crude oil: Currently net long 558.6k, down 14.9k.
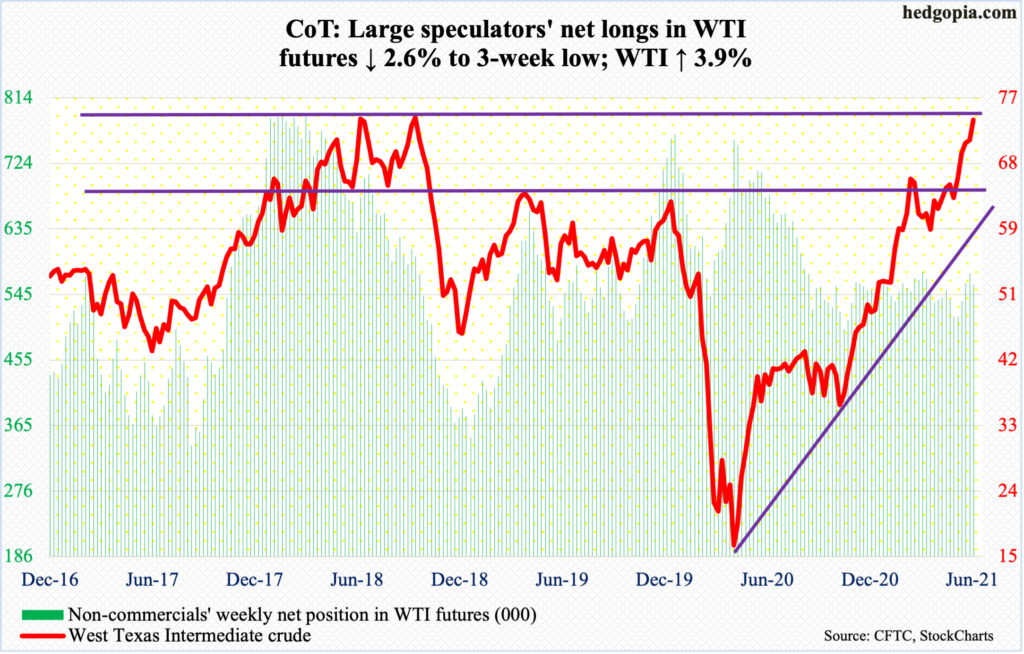
WTI ($74.05/barrel) racked up its fifth consecutive week of gains, rallying 3.9 percent. In Wednesday’s shooting star session, the crude ticked $74.25. This was preceded by Tuesday’s spinning top and followed by Thursday’s dragonfly doji.
These candles are appearing as WTI is testing crucial resistance. In October 2018, it reversed sharply lower after ticking $76.90; there is decent resistance around $75. Longs are sitting on tons of gains.
In April last year, WTI bottomed at $6.50. Gradually, one after another resistance gave way. Early this month, it broke out of $66-$67, which bulls and bears have fought over going back to 2006. This is where they are likely to lock horns when the next round of selling unfolds.
In the meantime, US crude production in the week to June 18 dropped 100,000 barrels per day to 11.1 million b/d. As did stocks of crude and gasoline, which respectively fell 7.6 million barrels and 2.9 million barrels to 459.1 million barrels and 240.1 million barrels. Distillate stocks, however, rose 1.8 million barrels to 137.9 million barrels. Crude imports increased as well – up 197,000 b/d to 6.9 mb/d. Refinery utilization decreased four-tenths of percentage point to 92.2 percent.
E-mini S&P 500: Currently net long 59.3k, up 76k.
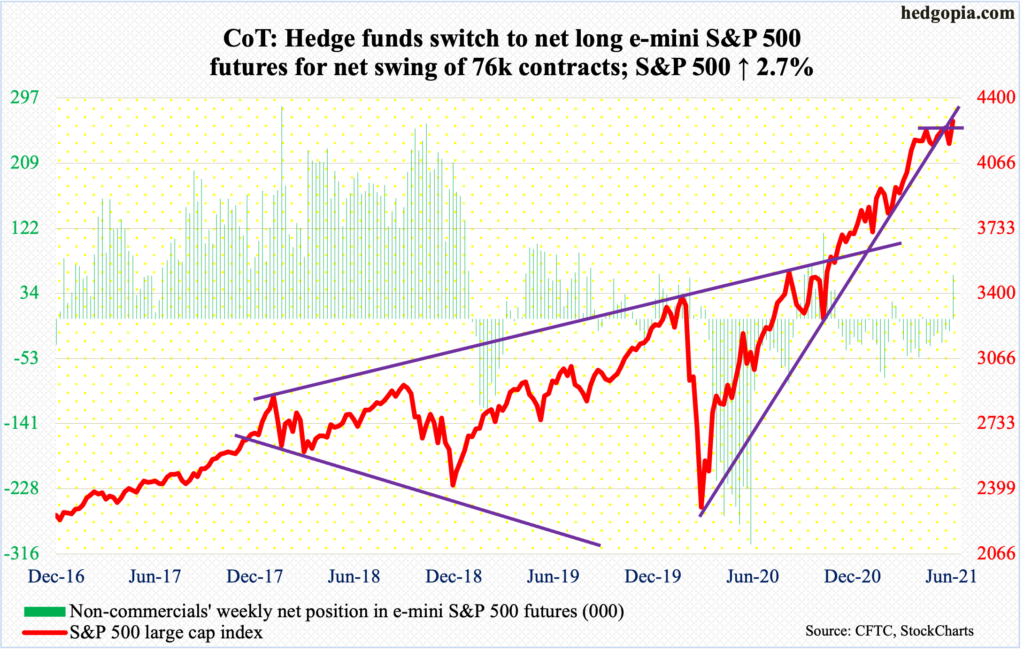
Last Tuesday’s new all-time high of 4257 was taken out this Thursday as the S&P 500 rather meekly posted a new intraday high of 4271, which was then eclipsed on Friday with a new high of 4286.
Last week, bulls managed – once again – to defend the 50-day. Since May last year, the average has been successfully tested several times; there were a few breaches but were not lasting. Last week, too, the index closed out just under the average on Friday – right at the daily lower Bollinger band. This week, it rallied 2.7 percent, although with lackluster volume.
Non-commercials, who had amassed nearly 80k net shorts by mid-February, went net long this week, with 59.3k contracts. This is quite a U-turn on their part. They were clearly caught wrong-footed the past four months and got squeezed. Time will tell if they have jumped on the bullish bandwagon a little too late.
Immediately ahead, the S&P 500 (4281) has support at 4250s.
Euro: Currently net long 89.1k, down 29.1k.
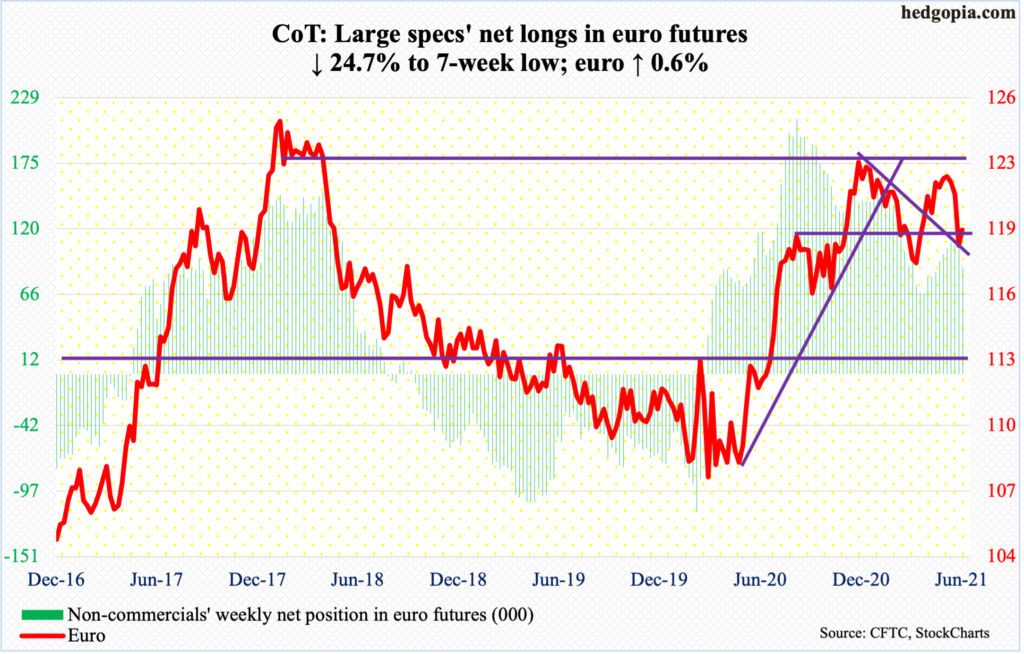
Last week, the euro ($1.1936) broke just under crucial horizontal support at $1.19-$1.20, which goes back 18 years. This week began with Monday’s 0.5-percent rally, which pushed the currency back into the zone. By Friday, it rallied as high as $1.1976, which just about tested the 200-day ($1.1992); sellers soon showed up. In fact, the last three sessions of the week all saw candles with long upper shadows.
For now, the euro remains trapped in the zone. Either way it breaks, momentum likely follows. Right here and now, downside risks outweigh upside rewards.
Gold: Currently net long 166.2k, down 25.8k.
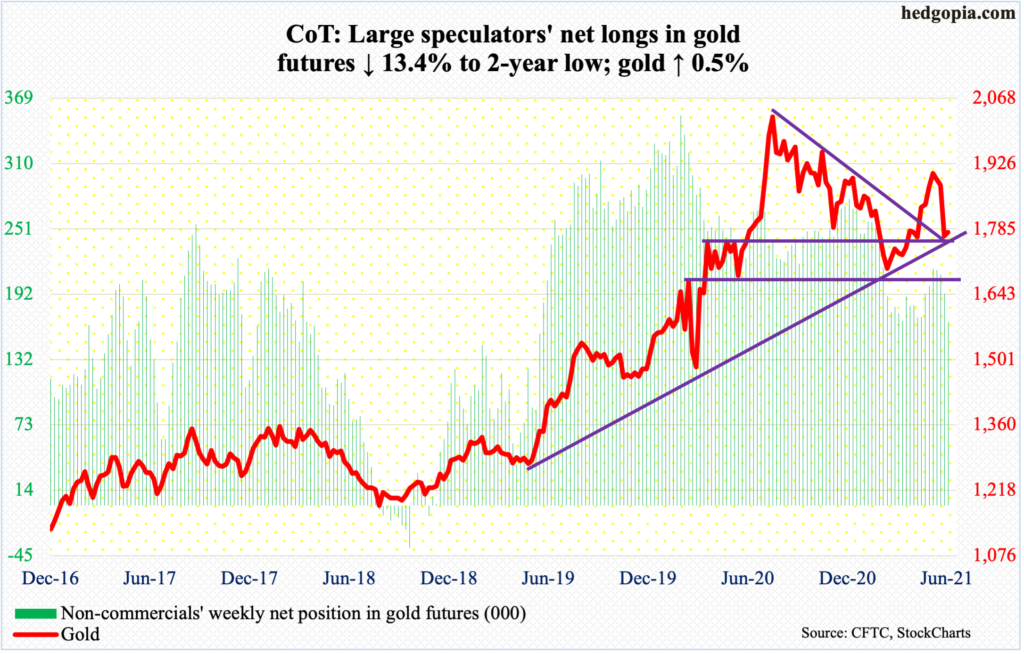
Gold ($1,777.80/ounce) pretty much went sideways this week, even though it was up 0.5 percent. Last Friday, the metal closed right on horizontal support at $1,760s-$1,770s. This was also the case this week.
Earlier, gold bottomed at $1,670s in March before rallying to eventually get rejected at $1,920s; this took place several times in the first couple of weeks this month. In September 2011, the yellow metal peaked at $1,920s, before coming under pressure to eventually bottom at $1,045 in December 2015.
Thus far, gold bugs have defended $1,760s-$1,770s. But at the same time the yellow metal was rejected just under $1,800 all week. Recapturing of this level is the first sign they are beginning to regain momentum.
In the meantime, non-commercials have now reduced their net longs to a two-year low.
Nasdaq 100 index (mini): Currently net short 10.4k, down 669.
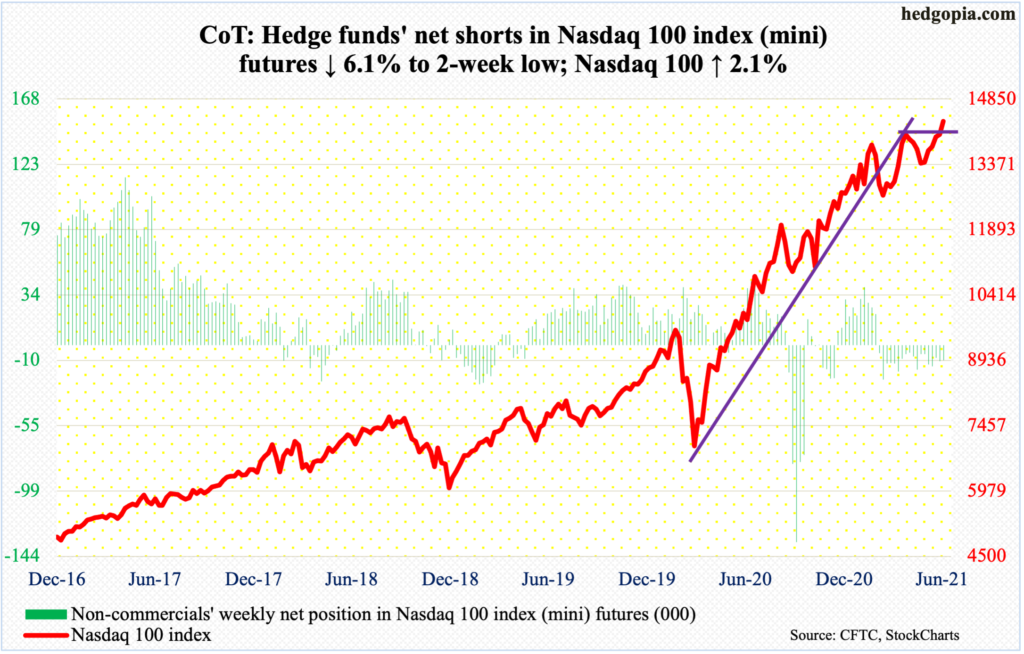
The Nasdaq 100 (14345) broke out of 14000 this week to a new record. Up 2.1 percent for the week, the weekly candle looks fine. On the daily, though, both Wednesday and Thursday formed a gravestone doji – all along the sharply rising daily upper Bollinger band.
Other than that, momentum lies with the bulls.
The daily is extended. How things transpire around 14000 will indicate if this week’s breakout will have the staying power.
Russell 2000 mini-index: Currently net short 37.6k, down 12.3k.
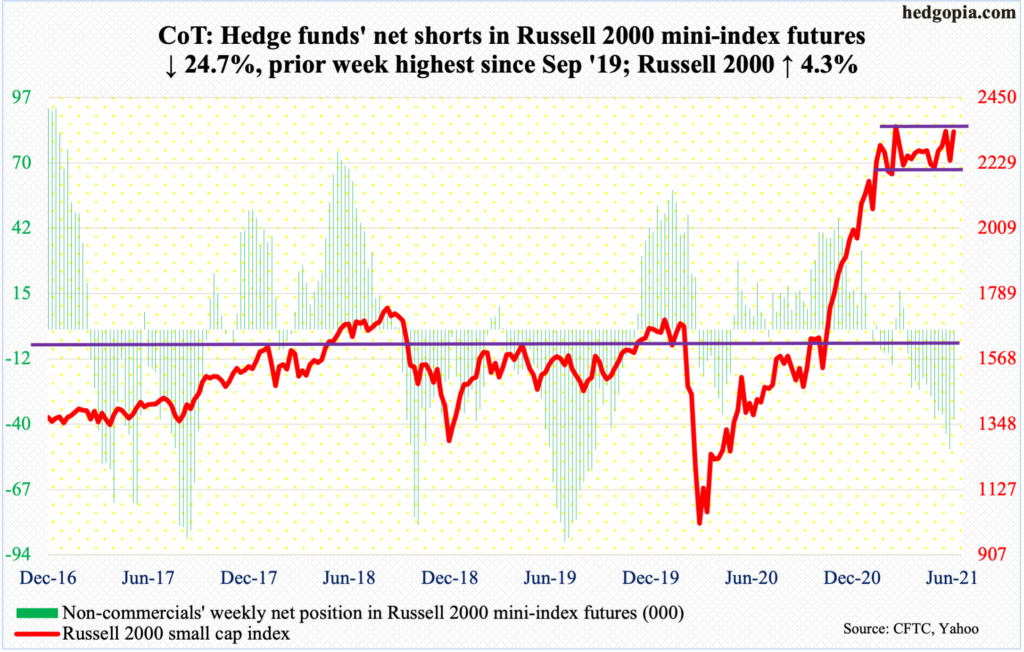
Several times over the last three weeks, the Russell 2000 came close to eclipsing its record high of 2360 posted on March 15. Close but no cigar. No breakout occurred. On Friday, it came within less than 10 points of matching that high before reversing to end the session essentially flat.
This week, the small cap index (2334) rallied 4.3 percent, rallying in all five sessions. Importantly, it is back above 2280s resistance.
Short squeeze is possible should 2350s-60s decisively give way.
Mid-June, IWM (iShares Russell 2000 ETF) short interest stood at 130.5 million, which was the highest since September 2015. Concurrently, non-commercials last week were sitting on net shorts that were the highest since September 2019; they slightly cut back this week, but holdings remain large.
US Dollar Index: Currently net short 510, down 1.8k.
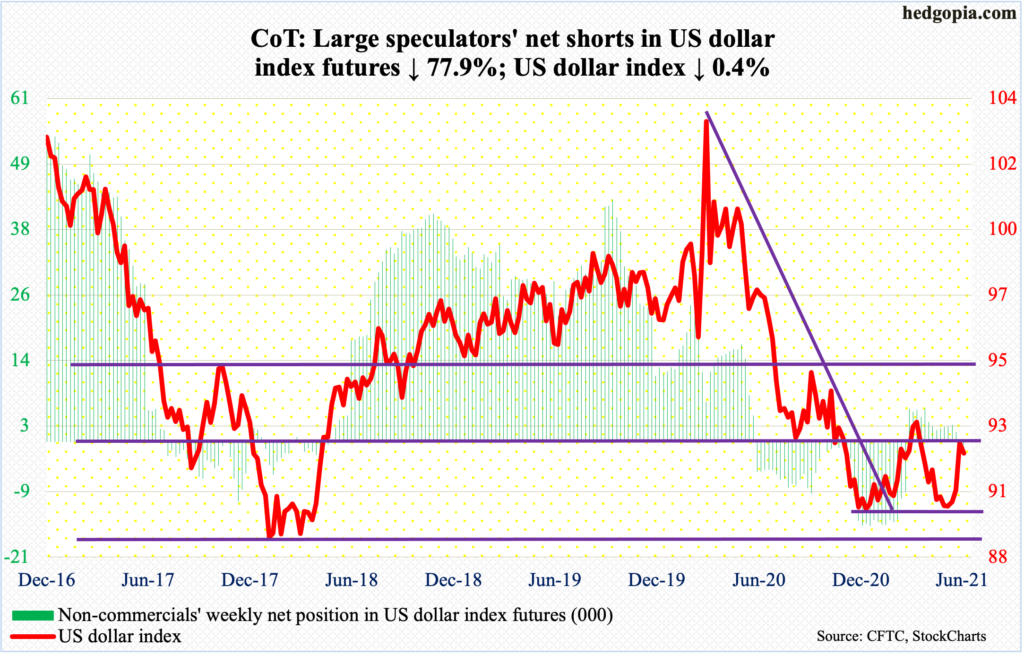
The US dollar index dropped as low as 89.17 on January 6, having peaked at 103.96 in March 2020. Support at 88-89 goes back at least 17 years and has held. On May 25 (this year), a higher low of 89.52 was set, followed by another higher low of 89.83 on the 9th this month.
This ultimately resulted in the release of pent-up energy, proceeding to test important resistance just north of 92. Last Friday, 92.40 was tagged, which was followed by a high of 92.36 on Monday (this week).
There is room for weakness. But for momentum to build to the downside, bears need to reclaim the 200-day (91.56). Bulls defended the average in the latter three sessions this week.
VIX: Currently net short 61.8k, down 7k.
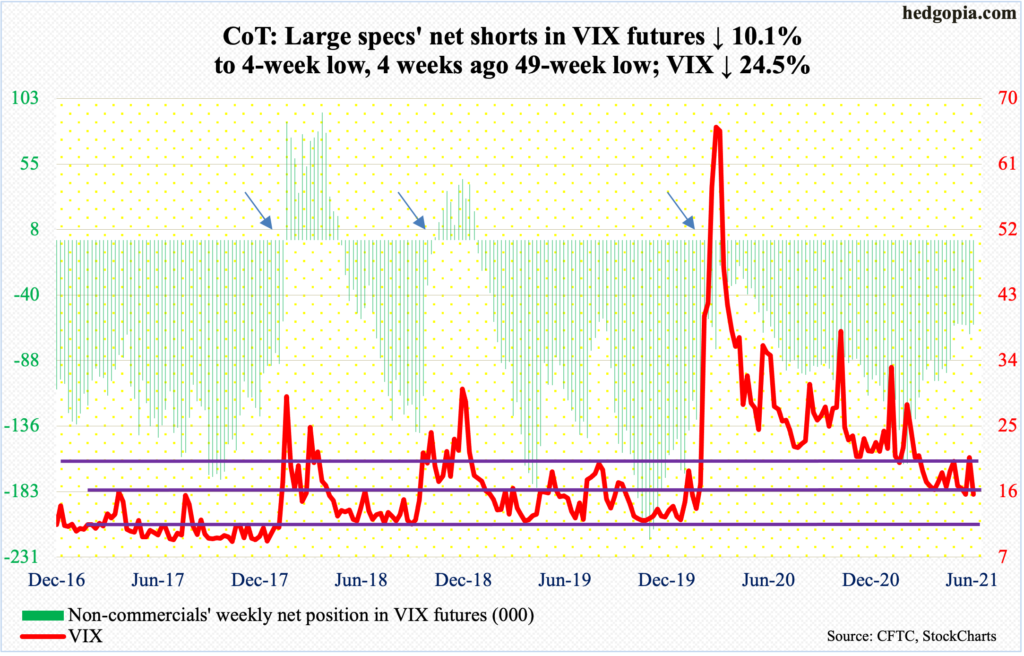
For the first time since February last year, VIX dropped below 15. On Wednesday and Thursday, the volatility index ticked 14.86 and 14.19 but only to close well above those intraday lows – 16.32 and 15.97 – resulting in a long-legged doji and a dragonfly doji respectively.
Despite these candles pointing to the likelihood of a reversal, the story remains the same with VIX, which is that it has been posting a series of lower highs, a patten in place since it peaked at 85.47 in March last year. Its most recent high was set at 25.96 on May 19; Monday’s 21.82 marks yet another lower high.
Disclaimer: This article is not intended to be, nor shall it be construed as investment advice. Neither the information nor any opinion expressed here constitutes an offer to buy or sell any ...
more

