
Large-Cap Vs. Small-Cap: Market "Tea Leaves"
Welcome to another trading week.
In appreciation of all of our readers at Finom Group, we offer the following excerpts from our Weekly Research Report. Our weekly report is extremely detailed and has proven to help guide investors and traders during all types of market conditions with thoughtful insights and analysis, graphs, studies, and historical data/analogs. Have a great trading week, be in touch, and take a look at some of the materials in this weekend’s published Research Report.
Research Report Excerpts #1
The breakout in the DJT is another sign of a broadening-out of market strength, within the context of the ongoing market consolidation. Breakouts can prove to be false breakouts upon retests to the downside and how investors engage such a retest. I would anticipate a retest in the coming week, so watch the DJT closely as the week progresses. Good things are happening underneath the surface of the major indices, you just need to know where to look. (chart from Chris Ciovacco)
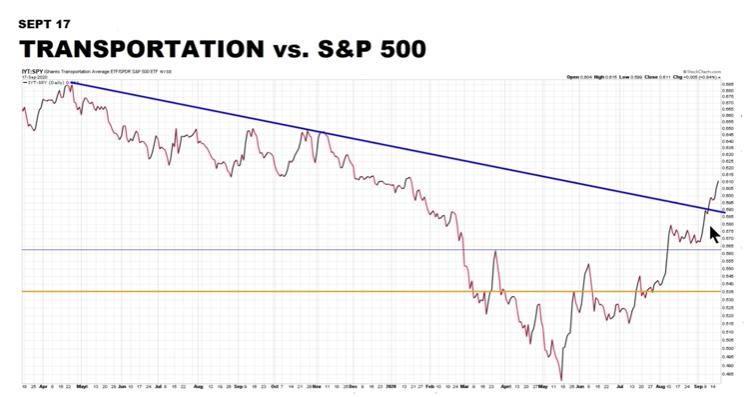
Moreover, the DJT:SPY ratio has also shown a breakout above a descending trend-line this past week. While the S&P 500 has weakened, this is just another way of validating that sector rotations are taking place and investors are still buying stocks/ETFs. The more sectors that prove to support the market, the likelihood that consolidation concludes and the uptrend resumes. Be patient, however, as there is nothing wrong with better valuations for the same fundamental sector or stock growth outlook. If you wanted cheaper prices, they are here; don’t overlook a sale. So let’s remind ourselves that stocks on sale are a good thing, but fear of price pressure is a bad thing with the following sentiment:
“You can often pinpoint the beginnings of investor underperformance when a bull market finds consolidation. The slightest hint of stocks declining brings out the worst in investors. The former “I’ll buy on a pullback” is replaced with gripping fear of falling prices. It takes courage to buy the dip. It takes courage to envision a better and brighter future ahead.”
Research Report Excerpts #2
Naturally, if the S&P 500 has fallen 8% and underperformed the Russell, the Nasdaq has a greater magnitude of underperformance relative to the Russell small-cap index. The Russell is only down 2.1% month-to-date while the Nasdaq is down 10.3% in September. The Russell is now on course for its best relative performance with the Nasdaq since 2016. If there is one chart that identifies how typical this market recovery cycle has been, it would be the following chart:
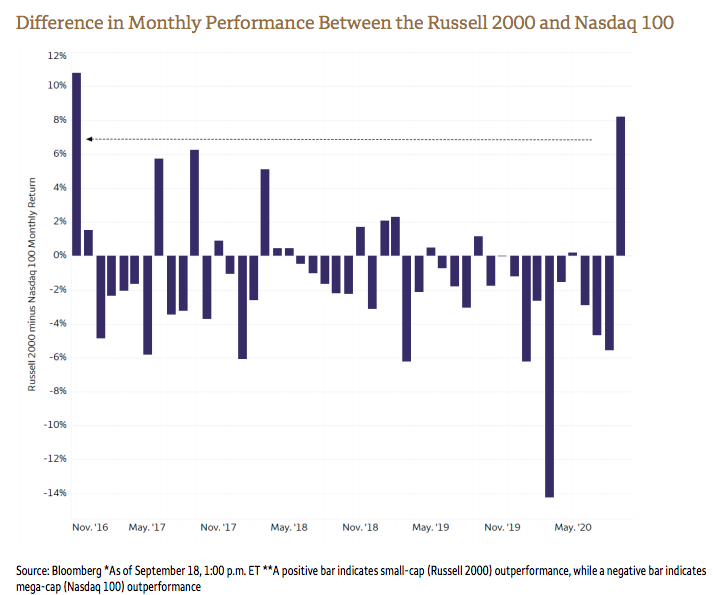
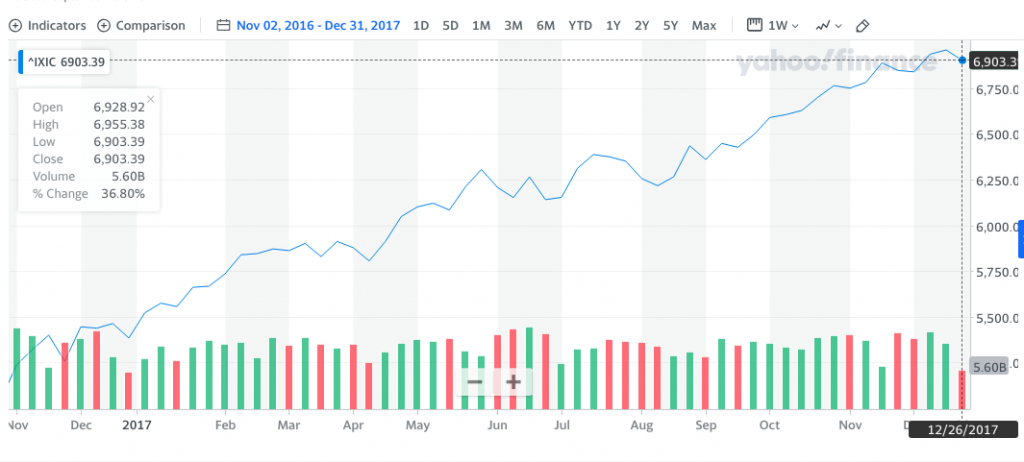
The Russell’s performance in late 2016 mirrors that of today. If we look back to that time period and project forward, investors might recognize the Nasdaq’s returns from November 2016 through all of 2017? (Nasdaq rose ~37%)
Research Report Excerpts #3
Given that the week following the September Options Expiration week is typically the absolute worst week for the S&P 500 annually, one might anticipate more weakness in the week ahead. This might find the S&P 50 filling this gap from 3,284 to 3,272, as shown in the chart above. The gap fill may find a tradable bounce and from there…
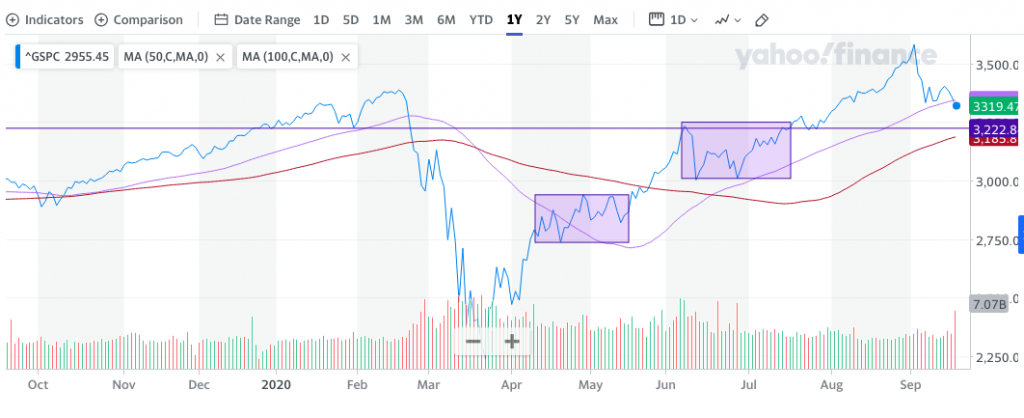
The S&P 500 (SPX) chart above identifies 2 separate consolidation periods that have already taken place since the March 2020 bottom. One of them found the 50-DMA breached to the upside and pushed back below, identifying resistance at the moving average. Ultimately the first consolidation period from late April to late May found a breakout until the first week of June, which identified another month-long consolidation period and subsequent breakout. The horizontal line in the chart identifies what has proven a very, prominent magnet for price action going all the way back to December of 2020.
In the chart, we can see that price revisited the 3,220-3,330s several times since December 2020. This level proved to be a peak in early June and then support in mid-July. Given the frequency for which price revisited this magnet level, I would greatly recognize this level of potential support within your portfolio management game plan and until the consolidation period has culminated.
Research Report Excerpts #4
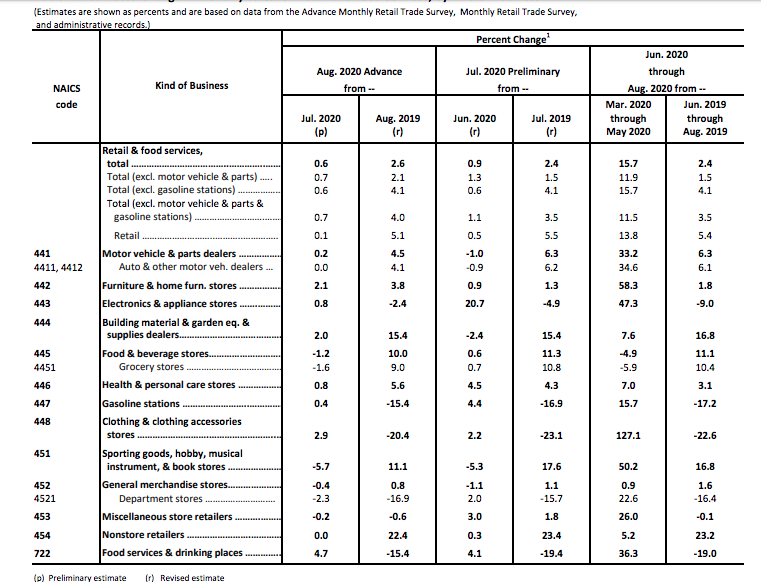
Looking at the various segments of the retail sales report above, sales gains were supported by the continued recovery in restaurants, up 4.7% (but still down 17% year over year), and housing-related spending. Weak spots included food sales, sporting goods (off elevated levels), and department stores as usual. E-commerce sales continued to chug along, growing 20% year over year but were unchanged from July’s levels. I’m of the opinion that e-commerce will continue to siphon sales from department stores for the foreseeable future. Specialty apparel and accessory retailers are not immune to this dynamic either.
The consumer recovery from the pandemic has been impressive despite the shortfall in August retail sales. Fading stimulus and still-high unemployment may slow the pace of consumer spending growth this fall, but the progress to date is encouraging. **Remember, September is typically the worst retail sales month of the year, showing a typical MoM drop, as September bookends the back-to-school season and comes ahead of the holiday shopping season (Halloween and Q4 holidays). This is really an important reminder folks; simply no reason for excess shopping in September and the high August comps always prove a headwind for September retail sales.
Research Report Excerpts #5
GOLDMAN: “The prospects for further fiscal stimulus have dimmed further, as another week has gone by without any progress.
Failure to pass any additional fiscal measures would likely lead us to downgrade our growth estimates for Q4.”
If there is a surprise ahead for the markets and the country, at this point, and with everyone focused on the proximity of the presidential election cycle, I think it might come from a late-October fiscal relief bill. I’m of the opinion that polling suggests a tight race as we head into October. If equity markets can’t gather themselves and resume the uptrend in early October, this will put that much more pressure on the legislature, as the weakness in the stock market by then may prove to play out in the economic data as well. We’ve seen a weak market in the Q4 holiday period turn into a weakening of the economy before (2018), and the election year statistics would not bode well under such circumstances for the White House Administration.
While this is just one man’s opinion, Nomura’s Charlie McElligott shares some similar thoughts on the subject matter:
Research Report Excerpts #6
The stock market, as always, is a forward-looking, discounting mechanism. It is pricing in future earnings growth, or in the case of downside price action, future earnings declines as it did during Q1 2020. For those who still believe that the market is disconnected from reality, definitions and historic data for the stock market and what drives it are proven time and time again. Recall that in 2009, the market bottomed in March, just as it has in 2020. Now, take a look at the quarterly S&P 500 EPS performance around this time period from 2008-2009:
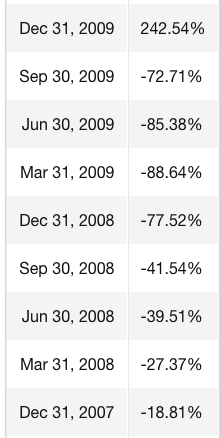
Earnings were materially and magnificently direr in 2009 than they are in the current earnings recession. Because the drop was so significant in 2009 earnings, the dramatic Q4 rise in earnings was being foreshadowed in the stock market’s performance throughout that year. I would be of the opinion, as I recall from this time period, that the issues of today’s economic recovery are actually not as concerning as the issues surrounding the 2009 economic recovery. Nonetheless, markets are doing what they are supposed to do and have always done in the past, discount future earnings as they did in 2009.
Market Seems Crazy, But History Suggests Otherwise:

- Least you think the stock market has lost its mind (which perhaps it has), it is historically “normal” for rallies in stocks to accompany still-weak earnings. As the table above shows, the best range for earnings in terms of accompanying stock market performance is -20% to +5%.
- The data is culled by our friends at Ned Davis Research; and I recently asked them to look at that particular bracket to see the performance difference if earnings were rising into that bracket vs. falling into that bracket.
- In the case of the former, stocks have returned nearly 26% on an annualized basis when earnings were in that bracket. Yes, stocks have had their worst performance during periods when earnings were imploding (by more than -20%); but given their “discounting mechanism” nature, stocks tended to rise sharply in anticipation of the improvement (i.e., they don’t “wait” until it’s already clear).
Research Report Excerpts #7
And as far as those pesky valuation concerns might be, take a look at today’s Big-5 P/E ratio vs. 2000.
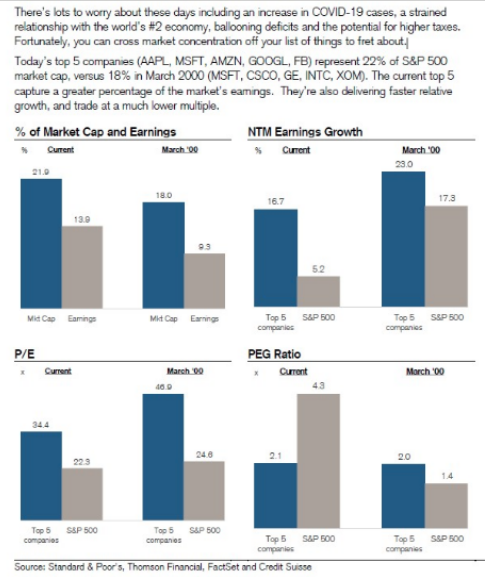
Valuations for the BIG-5 technology-like names are not nearly as extreme as they were in 2000, and yet the earnings power & faster relative growth suggests it should be more extreme. Market concentration is the least of our worries at this point.
The correction underway for the Nasdaq seems extreme as it has already reached double-digit levels, putting the index back below its 50-DMA. Even with the Nasdaq down some 12% from its record highs and below its 50-DMA, the tech-heavy index is still ~13% above its 200-DMA. Is it possible for the index to fall another 13% and touch the 200-DMA? Yes! Having said that, the probabilities I believe to be less than 20% given the long-term trend strength for the Technology and Communications Services sector. But let’s not forget…
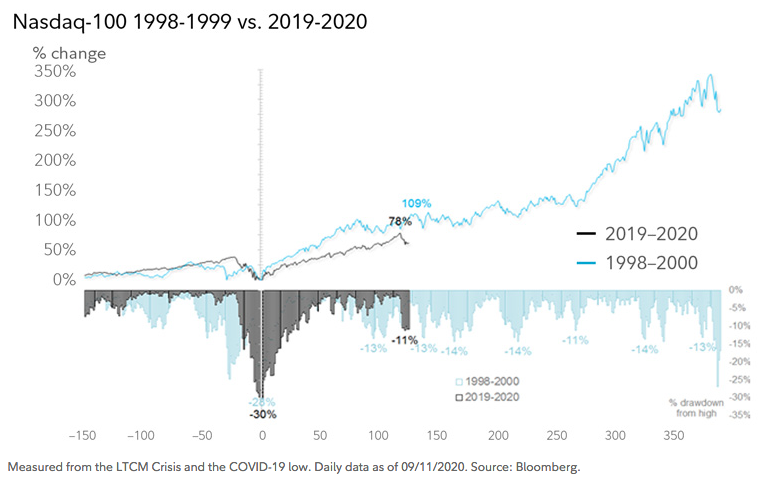
- The 1998-2000 Nasdaq analog, there seems to be more room left in the Nasdaq bull market.
- One thing to remember is that the 1998–2000 parabolic period for the Nasdaq was rife with corrections of 10%–15%.
- Per the chart above, we count 7 of them from the October 1998 low to the 2000 peak.
- On its own, the sharp correction of the past 2 weeks tells us very little about whether a lasting top is being formed.
Research Report Excerpts #8
Morgan Stanley’s Chief Investment Officer Lisa Shalett mirrors the aforementioned sentiment in the following comments:
“We also believe that politics may be playing a role in the delay of the next round of stimulus. We expect higher unemployment checks to be sent, just as ballots are being cast. While we do think that the market could sell off given a delayed presidential election result, in our view, that scenario could prove short-lived and may present a buying opportunity.
We recommend that investors prepare now for the robust economic rebound we see coming in 2021 by stock-picking among cyclical and high-quality growth names that currently trade at reasonable levels.”
Markets have trended higher regardless of which party wins the election:

Politics can bring out strong emotions and biases, but investors would be wise to tune out the noise and focus on the long term. That’s because elections have, historically speaking, made essentially no difference when it comes to long-term investment returns.
Which party is in power hasn’t made a meaningful difference to stocks either. Over the last 85 years, there have been seven Democratic and seven Republican presidents, and the general direction of the market has always been up. What should matter more to investors than election results is staying invested? With abundant market liquidity and the understanding that politicians have no stomach for a recession, investors are still best positioned in the equity markets with a long-term time horizon. And as for stock picking…
Research Report Excerpts #9
In recognition of the aforementioned: How much courage do you think you can muster should the markets fall another 5-10% near-term? This is not a prediction of course! Nonetheless, if you haven’t considered this type of outcome in your game plan, then your game plan may not be complete. What gives me courage during such unprecedented times are recognizing the following: 1.) Liquidity is a “given” and more will be provided should there be a need and as outlined by the central banks around the world. 2.) The yield curve is not inverted.
Thank you for joining us for another trading week and reviewing our weekly “Must Knows”!


