
Large-Cap Growth And Momentum Lead US Equity Factors In 2020
The stakes have been high this year for choosing certain equity factors over others, as year-to-date results remind. Depending on your preference, 2020 has delivered mild losses so far—or deep declines, based on a set of exchange-traded funds.
Large-cap growth and momentum factors are currently posting slight setbacks year to date, based on data through yesterday’s close (May 4). Leading the horse race so far: iShares S&P 500 Growth (IVW), which is off a relatively light 4.1% for 2020.

A close second year-to-date performer: iShares Edge MSCI USA Momentum Factor (MTUM). The fund is down 5.9% in 2020 through Monday’s close.
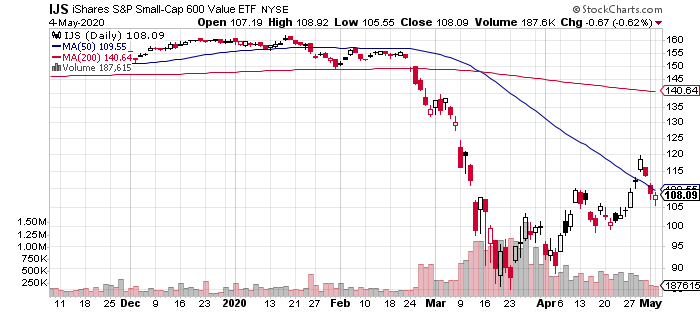
The rest of the field is nursing considerably deeper losses. The deepest is in small-cap value shares. The iShares S&P Small-Cap 600 Value (IJS) has tumbled more than 32% so far this year. Although the fund has recovered some of its earlier losses in the recent market decline, the rebound has been weak and recent trading sessions suggest the ETF is again succumbing to financial gravity.
For comparison, US equities overall are down 11.4% year to date, based on the SPDR S&P 500 (SPY), a benchmark for the market.

Stocks overall have rebounded off the year’s lows, but some analysts question the persistence of the bounce. “There are a number of investors that think that maybe we have gone a little too far, a little too fast,” says Mark Stoeckle, chief executive officer of Adams Funds.
There’s also concern that the recent rebound is overly reliant on the biggest companies, including the largest tech firms, such as Microsoft, Apple, Amazon, and Netflix. Ken Johnson, investment strategy analyst at Wells Fargo writes in a research note that “megacaps mask underlying rally fragility. This concentration raises concerns about the rally’s long-term health and durability as it suggests that ample liquidity, rather than broadly improving fundamentals, may be fueling it.”
Reviewing all the factor ETFs listed above through a momentum lens still paints a cautious picture, based on two sets of moving averages. The first measure compares the 10-day average with its 100-day counterpart — a proxy for short-term trending behavior (red line in chart below). A second set of moving averages (50 and 200 days) represent an intermediate measure of the trend (blue line). Using data through yesterday’s close shows that all the factor funds continue to post extremely bearish momentum trends. Although the recent rally has provided some lift after sharp declines, the jury’s still out on whether the bounce is more than a bear market rally.

Disclosure: None.


