
Kors Returns To Number One As Our Top-ranked S&P500 Stock
For today's bulletin, we present key metrics for the top picks in the S&P 500. The companies listed below represent the top-ten BUY/STRONG BUY stocks within the index. They are presented below according to their one-month forecast target prices.
In our last edition. Micahel Kors was finally dethroned as our top-ranked SP500 stock. But, the reign of new leader CBS at the top of our chart did not last long. Today's query of our systems shows that Kors is back at number one while CBS has fallen to the number four spot.
This week, we find that KLA-Tencor also declined to make room for Kors' return to the premier spot. We also see that Applied Materials, Tyson Foods, UTD Rentals, and Zimmer Biomet managed to move up a few spots. Turnover was relatively light, with newcomers LAM Research, Broadcom, and International Paper just managing to creep into the top ten.
Scripps Networks, Global Payments, and Entergy have fallen out of our op-stick list. Our list is dominated by tech and consumer discretionary firms this month. And, each company in our top-ten list is ranked STRONG BUY or BUY this time around.
|
Ticker |
Company Name |
Market Price |
Valuation |
Last 12-M Retrn |
1-M Forecast Retn |
1-Yr Forecast Retn |
P/E Ratio |
Sector Name |
Sept. 15, 2016 |
|
MICHAEL KORS |
50.1 |
-30.06% |
25.97% |
1.29% |
15.53% |
11.57 |
Consumer Discretionary |
CBS |
|
|
APPLD MATLS INC |
28.32 |
-10.62% |
79.18% |
1.21% |
14.52% |
17.37 |
Computer and Technology |
KLAC |
|
|
TYSON FOODS A |
70.47 |
-5.25% |
52.60% |
1.19% |
14.29% |
15.25 |
Consumer Staples |
AMAT |
|
|
CBS CORP |
55.53 |
-13.42% |
29.38% |
1.12% |
13.43% |
14.42 |
Consumer Discretionary |
SNI |
|
|
KLA-TENCOR CORP |
71.94 |
2.43% |
35.43% |
1.04% |
12.53% |
14.33 |
Computer and Technology |
ETR |
|
|
UTD RENTALS INC |
75.58 |
-3.07% |
15.58% |
1.01% |
12.08% |
9.33 |
Construction |
KORS |
|
|
LAM RESEARCH |
99.72 |
7.66% |
47.43% |
0.97% |
11.69% |
15.78 |
Computer and Technology |
TSN |
|
|
BROADCOM LTD |
171.87 |
-1.81% |
44.48% |
0.96% |
11.55% |
18.06 |
Computer and Technology |
URI |
|
|
ZIMMER BIOMET |
128.08 |
-1.39% |
30.44% |
0.92% |
11.06% |
16.21 |
Medical |
GPN |
|
|
INTL PAPER |
48.28 |
-9.09% |
16.31% |
0.90% |
10.81% |
13.72 |
Basic Materials |
ZBH |
NOTE: New stocks are in BOLD, old stocks that have moved up the list are in GREEN, old stocks that have declined in position are in RED, and stocks which have retained their position are in CAPS.
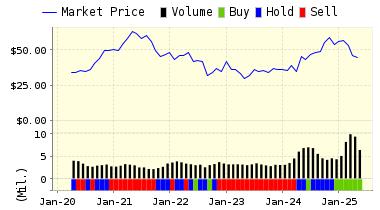
Below is today's data on one of our SP500 top-ten newcomers, International Paper Co. (IP).
International Paper Co. (IP) is a global paper and forest products company that is complemented by an extensive distribution system. The company produces printing and writing papers, pulp, tissue, paperboard and packaging and wood products. The company also manufacture specialty chemicals and specialty panels and laminated products. Its primary markets and manufacturing and distribution operations are in the United States, Europe, and the Pacific Rim.
ValuEngine continues its BUY recommendation on INTL PAPER for 2016-10-19. Based on the information we have gathered and our resulting research, we feel that INTL PAPER has the probability to OUTPERFORM average market performance for the next year. The company exhibits ATTRACTIVE Company Size and Sharpe Ratio.
|
ValuEngine Forecast |
||
|
Target |
Expected |
|
|---|---|---|
|
1-Month |
48.72 | 0.90% |
|
3-Month |
49.03 | 1.56% |
|
6-Month |
49.13 | 1.76% |
|
1-Year |
53.50 | 10.81% |
|
2-Year |
46.94 | -2.78% |
|
3-Year |
40.60 | -15.91% |
|
Valuation & Rankings |
|||
|
Valuation |
9.09% undervalued |
Valuation Rank(?) |
|
|
1-M Forecast Return |
0.90% |
1-M Forecast Return Rank |
|
|
12-M Return |
16.31% |
Momentum Rank(?) |
|
|
Sharpe Ratio |
0.64 |
Sharpe Ratio Rank(?) |
|
|
5-Y Avg Annual Return |
14.49% |
5-Y Avg Annual Rtn Rank |
|
|
Volatility |
22.50% |
Volatility Rank(?) |
|
|
Expected EPS Growth |
20.74% |
EPS Growth Rank(?) |
|
|
Market Cap (billions) |
20.45 |
Size Rank |
|
|
Trailing P/E Ratio |
13.72 |
Trailing P/E Rank(?) |
|
|
Forward P/E Ratio |
11.36 |
Forward P/E Ratio Rank |
|
|
PEG Ratio |
0.66 |
PEG Ratio Rank |
|
|
Price/Sales |
0.95 |
Price/Sales Rank(?) |
|
|
Market/Book |
30.12 |
Market/Book Rank(?) |
|
|
Beta |
1.56 |
Beta Rank |
|
|
Alpha |
0.05 |
Alpha Rank |
|
ValuEngine Market Overview
|
Summary of VE Stock Universe |
|
|
Stocks Undervalued |
52% |
|
Stocks Overvalued |
48% |
|
Stocks Undervalued by 20% |
21.48% |
|
Stocks Overvalued by 20% |
16.43% |
ValuEngine Sector Overview
|
Sector |
Change |
MTD |
YTD |
Valuation |
Last 12-MReturn |
P/E Ratio |
|
0.38% |
-2.21% |
16.15% |
6.15% overvalued |
12.53% |
24.07 |
|
|
0.18% |
-0.89% |
10.23% |
5.33% overvalued |
11.60% |
22.12 |
|
|
1.45% |
3.72% |
36.35% |
5.24% overvalued |
-5.71% |
26.66 |
|
|
1.15% |
-0.75% |
45.63% |
3.81% overvalued |
49.57% |
28.40 |
|
|
0.16% |
-2.35% |
15.53% |
3.55% overvalued |
4.38% |
29.44 |
|
|
0.64% |
-0.30% |
7.38% |
2.54% overvalued |
-1.26% |
20.98 |
|
|
-0.02% |
-1.80% |
10.96% |
2.04% overvalued |
9.00% |
24.77 |
|
|
0.46% |
-0.49% |
6.75% |
0.91% overvalued |
3.03% |
16.57 |
|
|
0.02% |
-0.18% |
2.72% |
0.18% overvalued |
5.07% |
17.98 |
|
|
0.16% |
-1.78% |
12.67% |
1.14% undervalued |
-1.97% |
24.39 |
|
|
0.21% |
-1.61% |
7.93% |
2.49% undervalued |
0.93% |
23.97 |
|
|
0.49% |
-0.39% |
9.54% |
2.82% undervalued |
-13.53% |
16.59 |
|
|
-0.03% |
-1.12% |
30.18% |
4.84% undervalued |
11.19% |
19.85 |
|
|
0.65% |
-0.45% |
0.11% |
5.25% undervalued |
-4.11% |
22.65 |
|
|
0.61% |
-1.07% |
6.71% |
5.89% undervalued |
7.05% |
15.01 |
|
|
-0.33% |
-2.16% |
0.75% |
6.46% undervalued |
-9.83% |
25.95 |
Disclaimer: ValuEngine.com is an independent research ...
more

