
Key Levels For A Trend Flip
We are working on some long-term research projects that can assist us going forward. However, it might be helpful to pass along some info related to the current market.
As demonstrated via numerous historical examples in this week’s video, if the market is going to reestablish a long-term bullish trend, there is typically time to adjust allocations along the way. Our goal is to put additional capital in harm’s way when the odds are more favorable relative to our timeframe.
Simple math tells us in order for the generic moving averages/trends to start turning up, one of two basic things needs to happen:
ONE: Price needs to rise above and hold above the 2630 to 2750 range.
TWO: The market needs to move sideways for a few weeks/months allowing the data to settle in at lower levels, which is typically how a sustainable bottom is formed.
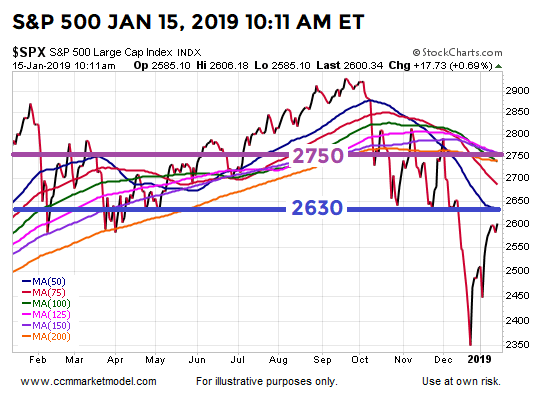
To illustrate concepts, let’s assume the S&P 500 shoots straight up and closes above 2750 today. As shown in the version of the chart below, that means price would move above a cluster of moving averages that all still have negative slopes. As shown in this week’s video, the odds of a rally failing are higher when price moves above downward-sloping moving averages. The key word in the previous sentence is odds. Does the current setup look like a high-probability area to add to the growth side of the portfolio (see blue arrow below)?

It is entirely possible price shoots to the moon and stocks rally strongly for two more years, but in that scenario there would be plenty of time for the data to improve and for us to migrate back to a full growth allocation. We do not attempt to trade countertrend moves in an established downtrend. We want to move in a prudent, patient, logical, and data-based manner, rather than based on the fear of missing out.
Thus, if really good things are going to happen for a long period of time (a favorable period to have our capital in harm’s way), one of the two items noted above needs to occur. During Tuesday’s session the S&P 500 was trading at 2611, or below the 2630-2750 range noted above. Therefore, as of this writing, neither of the two things that need to happen have happened.
Our purpose here is not to forecast or favor any outcome, but rather to assess the current risk-reward environment. The current environment features downtrends on multiple timeframes. Nothing has materially changed relative to our timeframe since the publication of last Friday’s video.
It is extremely important to note, the generic moving averages above are used to illustrate basic concepts; they are not the data points used by the model to guide our decisions.
Disclaimer: The opinions in this document are for informational and educational purposes only and should not be construed as a recommendation to buy or sell the stocks mentioned or to solicit ...
more

