
June Jobs Report: 4.8M Jobs Added, Unemployment Rate Drops To 11.1%
This morning's employment report for June showed a 4.8M increase in total nonfarm payrolls, which was above the Investing.com forecast of 3M.
Here is an excerpt from the Employment Situation Summary released this morning by the Bureau of Labor Statistics:
Total nonfarm payroll employment rose by 4.8 million in June, and the unemployment rate declined to 11.1 percent, the U.S. Bureau of Labor Statistics reported today. These improvements in the labor market reflected the continued resumption of economic activity that had been curtailed in March and April due to the coronavirus (COVID-19) pandemic and efforts to contain it. In June, employment in leisure and hospitality rose sharply. Notable job gains also occurred in retail trade, education and health services, other services, manufacturing, and professional and business services.
This news release presents statistics from two monthly surveys. The household survey measures labor force status, including unemployment, by demographic characteristics. The establishment survey measures nonfarm employment, hours, and earnings by industry. For more information about the concepts and statistical methodology used in these two surveys, see the Technical Note.
Coronavirus (COVID-19) Impact on April 2020 Establishment and Household Survey Data
Data collection for both surveys was affected by the coronavirus (COVID-19) pandemic. In the establishment survey, approximately one-fifth of the data is assigned to four regional data collection centers. Although these centers were closed, interviewers at these centers worked remotely to collect data by telephone. Additionally, BLS encouraged businesses to report electronically. The collection rate for the establishment survey in June was 63 percent, lower than collection rates prior to the pandemic. The household survey is generally collected through in-person and telephone interviews, but personal interviews were not conducted for the safety of interviewers and respondents. The household survey response rate, at 65 percent, was about 18 percentage points lower than in months prior to the pandemic.
In the establishment survey, workers who are paid by their employer for all or any part of the pay period including the 12th of the month are counted as employed, even if they were not actually at their jobs. Workers who are temporarily or permanently absent from their jobs and are not being paid are not counted as employed, even if they are continuing to receive benefits. In the household survey, individuals are classified as employed, unemployed, or not in the labor force based on their answers to a series of questions about their activities during the survey reference week (June 7th through June 13th). Workers who indicate they were not working during the entire survey reference week and expect to be recalled to their jobs should be classified as unemployed on temporary layoff. In June, a large number of persons were classified as unemployed on temporary layoff.
As was the case in March, April, and May, household survey interviewers were instructed to classify employed persons absent from work due to temporary, coronavirus-related business closures as unemployed on temporary layoff. BLS and Census Bureau analyses of the underlying data suggest that this group still included some workers affected by the pandemic who should have been classified as unemployed on temporary layoff.
The degree of misclassification declined considerably in June. BLS and Census Bureau staff have been reviewing survey responses that might have been misclassified. The misclassification hinges on a question about the main reason people were absent from their jobs. If people who were absent due to temporary, pandemic-related closures were recorded as absent due to “other reasons,” they could have been misclassified. When interviewers record a response of “other reason,” they also add a few words describing that other reason. The review of these brief descriptions found that the share of responses that may have been misclassified was much smaller in June than in prior months. BLS and the Census Bureau are continuing to investigate the misclassification and are taking additional steps to address the issue.
If the workers who were recorded as employed but absent from work due to “other reasons” (over and above the number absent for other reasons in a typical June) had been classified as unemployed on temporary layoff, the overall unemployment rate would have been about 1 percentage point higher than reported (on a not seasonally adjusted basis). However, this represents the upper bound of our estimate of misclassification and probably overstates the size of the misclassification error.
According to usual practice, the data from the household survey are accepted as recorded. To maintain data integrity, no ad hoc actions are taken to reclassify survey responses.
More information is available at www.bls.gov/cps/employment-situation-covid19-faq-june-2020.pdf.
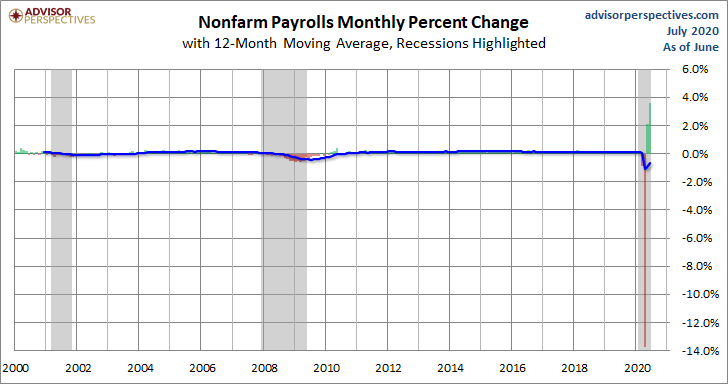
Here is a snapshot of the monthly percent change in Nonfarm Employment since 2000. We've added a 12-month moving average to highlight the long-term trend.
The unemployment peak for the last cycle was 10.0% in October 2009. The chart here shows the pattern of unemployment, recessions and the S&P Composite since 1948. Unemployment is usually a lagging indicator that moves inversely with equity prices (top series in the chart). Note the increasing peaks in unemployment in 1971, 1975, and 1982. The mirror relationship appears to repeat itself with the previous bear markets. The COVID-19 pandemic, however, has been a different case.

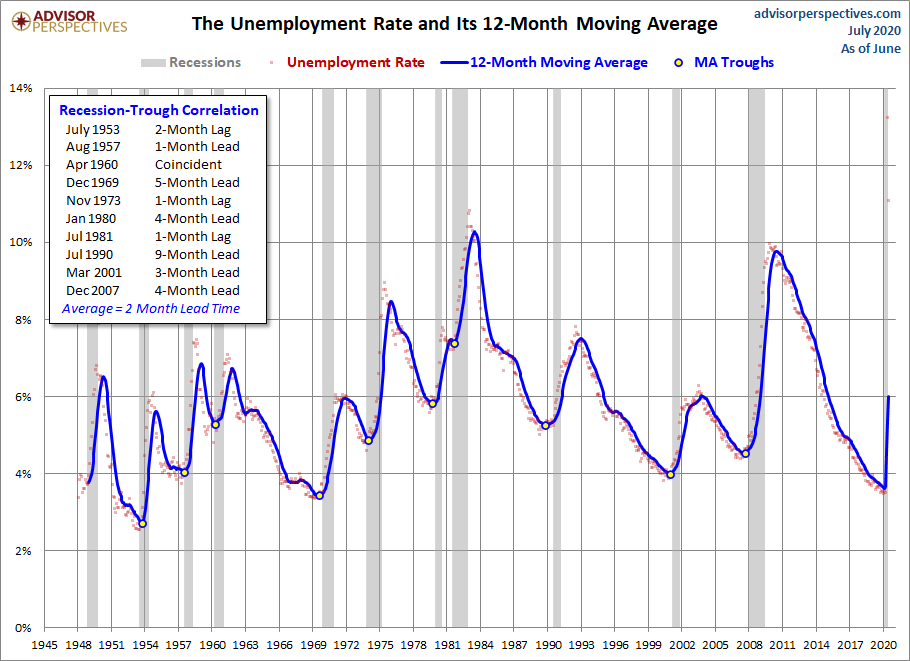
Now let's take a look at the unemployment rate as a recession indicator or more specifically the cyclical troughs in the UR as a recession indicator. The next chart features a 12-month moving average of the UR with the troughs highlighted. As the inset table shows, the correlation between the MA troughs and recession starts is remarkably close.
Here's another chart to illustrate the reality of the unemployment rate - the unemployment rate divided by the labor force participation rate.

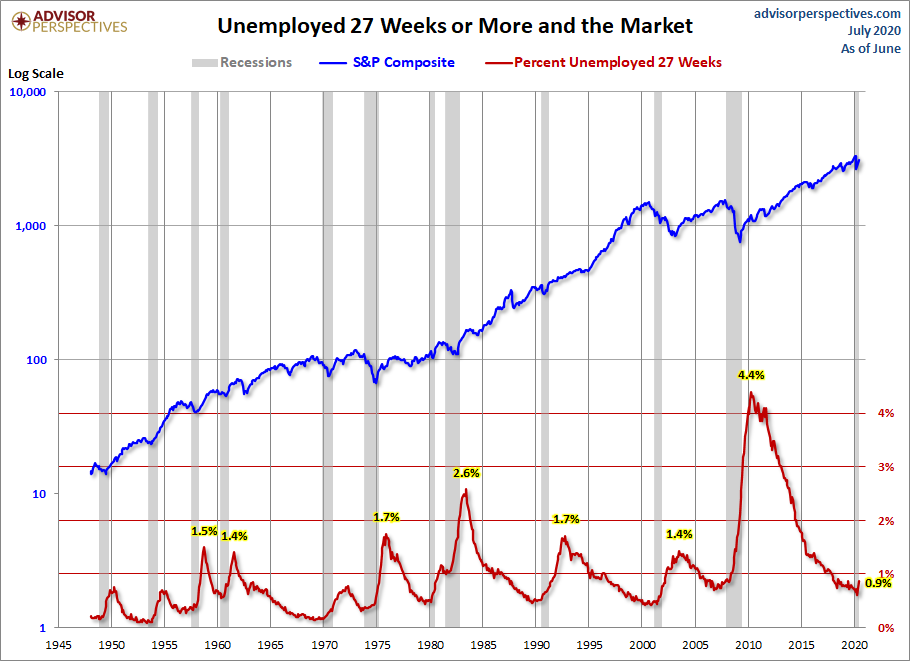
The next chart shows the unemployment rate for the civilian population unemployed 27 weeks and over. This rate has fallen significantly since its 4.4% all-time peak in April 2010. It is now at 0.9%, up from the previous month.
The next chart is an overlay of the unemployment rate and the employment-population ratio. This is the ratio of the number of employed people to the total civilian population age 16 and over.
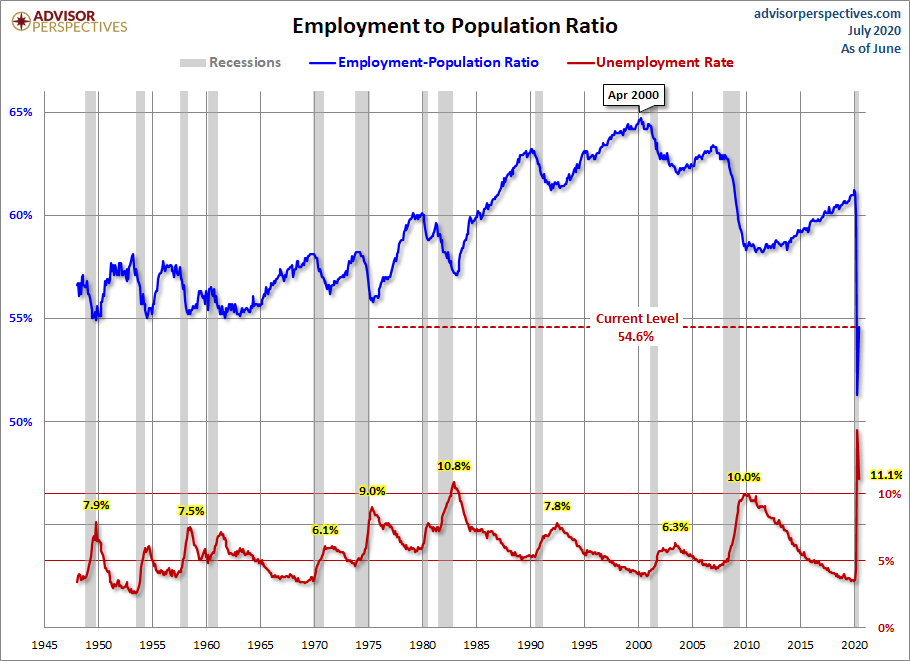
The inverse correlation between the two series is obvious. We can also see the accelerating growth of women in the workforce and two-income households in the early 1980's. Before the COVID-19 pandemic, the employment-population was range-bound between 58.2% and 60.6% — the lower end of which that harkens back to the 58.1% ratio of March 1953, when Eisenhower was president of a country of one-income households, the Korean War was still underway, and rumors were circulating that soft drinks would soon be sold in cans. Because of the global pandemic, we are seeing employment-population ratios at their lowest levels ever. About half of the 16 and overpopulation is currently employed.
The latest ratio of 54.6% is above its lowest level in the series' history, but still below pre-COVID figures.
For a confirming view of the secular change the US is experiencing on the employment front, the next chart illustrates the labor force participation rate. We're at 61.5%, up from last month's 60.8%.
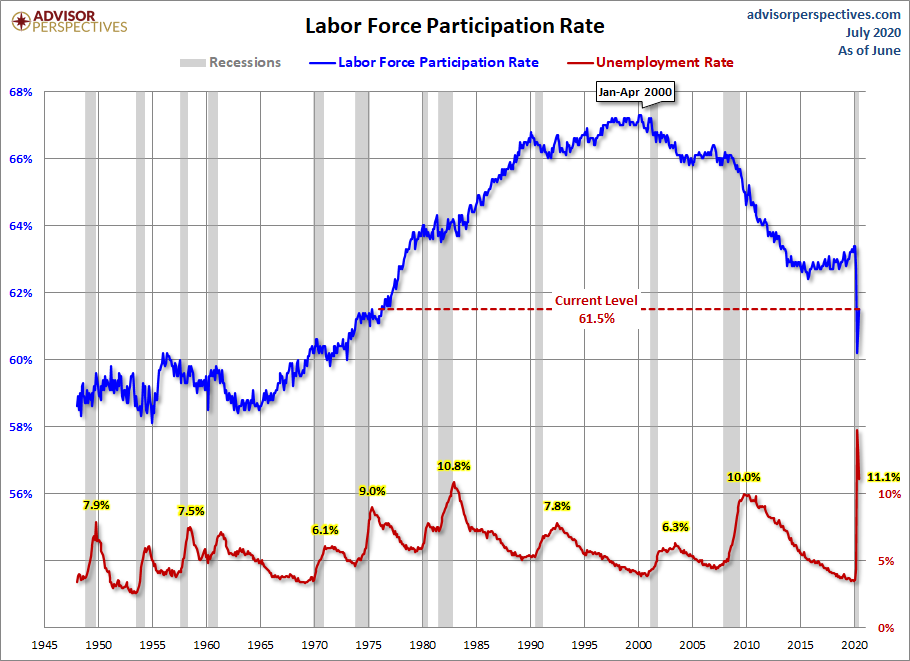
The employment-population ratio and participation rate will be interesting to watch going forward. The first wave of Boomers will continue to be a downward force on this ratio. The oldest of them were eligible for early retirement when the Great Recession began, and the transition of the Boomer cohort to full retirement age won't end until 2030.
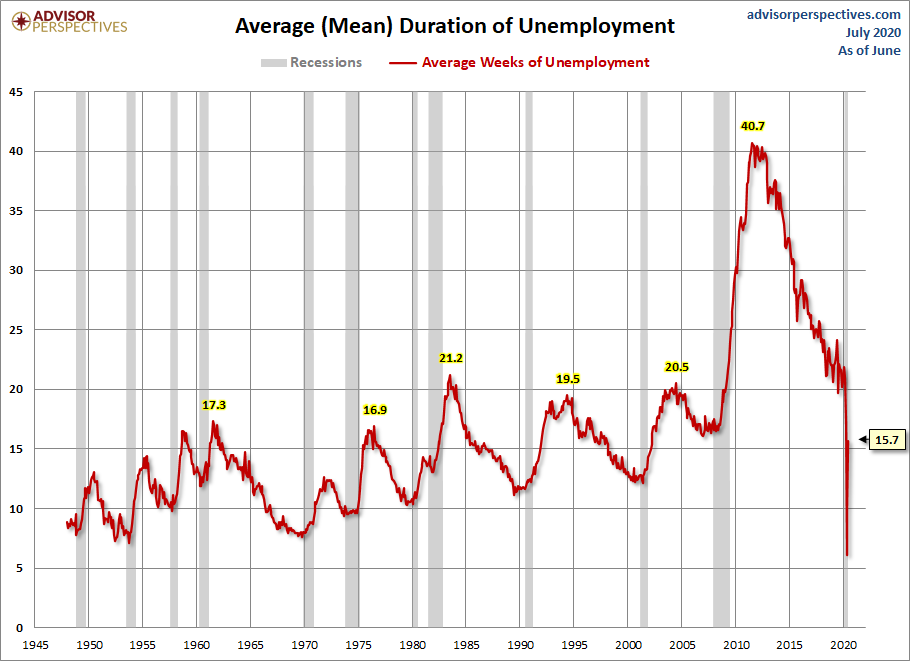
What is the average length of unemployment? As the next chart illustrates, we are perhaps seeing a paradigm shift — the result of global outsourcing and efficiencies of technology. The duration of unemployment at of June 2020 is at 15.7 weeks, well off the 40.7-week all-time high in late 2011.
The Bureau of Labor Statistics' broadest measure of unemployment is the U6 series, which includes the total unemployed, plus all marginally attached workers plus total employed part-time for economic reasons. This series dates from 1994.
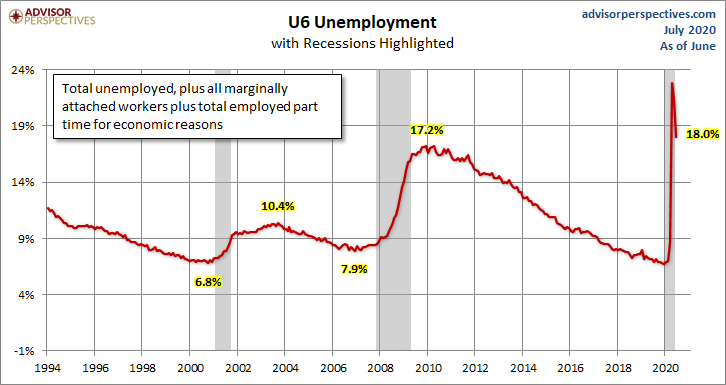
The U6 series is currently at 18%.
Notes: The start date of 1948 in the charts above was determined by the earliest monthly employment data collected by the Bureau of Labor Statistics. The best source for the historical data is the Federal Reserve Bank of St. Louis.
The S&P Composite is a splice of the S&P500, which started in 1957, with the S&P 90, which preceded it.


