
June 2020 Economic Forecast - The Real Question Is How Much The Economy Will Rebound
Econintersect's Economic Index forecast crashed last month but marginally improved this month but remains deeply in contraction. What is happening to the economy is unprecedented, and no forecasting model could pretend it could be accurate. The economy began to open in May, and the reopening will grow in June so logic dictates that economically June should be better than May. I personally do not believe the economy will ever return to its old trends (an economic reset just occurred) - so more accurate forecasting must envision where the economic trends might be headed.

Analyst Summary of this Economic Forecast
Blame our lack of understanding of the coronavirus for much of the economic damage which has occurred. Hopefully, the powers-that-be and our scientific community will figure a better way to cope with a pandemic other than locking its citizens down and destroying economic growth. I have read 1/3rd of small business will have been destroyed by this knee jerk antiquated approach to a pandemic. Even big businesses will figure a way to do more with less people. Further, this pandemic has added trillions of debt to the government, business, and consumer sectors.
I belong to the school of thought that debt is a headwind to economic growth - borrow today and pay back tomorrow. For growth to stay the same, your old income + debt repayments = new income. Money was not borrowed to improve productivity/profits - it was borrowed to cover pandemic losses. Add this to the reality that there will be no quick recovery because:
- there are only partial reopenings currently;
- we have no clue if the pandemic will raise its ugly head again;
- there will be a mountain of bankruptcies;
- will there be an exodus from big cities? This would affect home prices and home sales volumes;
- working from home changes consumer spending patterns;
- and the major unknown is what changes consumers will make in their lifestyles. Likely consumers will not flock to restaurants anytime soon (businesses in this sector are at risk); sports will not be as profitable; return to gyms; or go to concerts.
Bottom line is that the gearing of the economy will be impacted - and change always creates disruption.
You do not have to be an economist to understand the U.S. was in a recession for the last two months. The way recessions are determined, recessions end when the economy begins to recover - and that means the recession likely will end in June. The question now is how fast will the economy will improve - and it is possible the pandemic will worsen in the U.S. and the citizens will be locked down again.
COVID-19 is a black swan economic event. Black swan events are unexpected at the time with immediate significant impact and are defined:
The black swan theory or theory of black swan events is a metaphor that describes an event that comes as a surprise, has a major effect, and is often inappropriately rationalised after the fact with the benefit of hindsight. The term is based on an ancient saying that presumed black swans did not exist - a saying that became reinterpreted to teach a different lesson after black swans were discovered in the wild.
The last time the U.S. had an event that stalled the economy immediately was the oil embargo in the early 1970s. Economic forecasting tools are not designed to anticipate black swans.
This month the indicators and predictive coincident indices are finally flashing recession signs.
As I stated last month, you cannot shut down the economy and expect distribution systems to work. I have witnessed over the last month movements of materials have bottomed and there are hints of improvement. But the rate of recovery seems insignificant at this point.
Our index's design is to forecast Main Street growth, whilst GDP is not designed to focus on the economy at Main Street level. One can suggest that GDP is a lagging indicator of the underlying economy - and does not accurately portray the strength and trends of the Main Street economy.
Although not part of our forecast, I am concerned that new and existing home sales volumes will be sickly for at least a year - although the forecasters in real estate think the recovery will be swift because of pent-up demand.
Note that the quantitative analysis which builds our model of the economy does not include housing, personal income, or expenditures data sets.
Econintersect checks its forecast using several alternate monetary-based methods - and they are currently all over the map.
Our employment forecast is forecasting POOR employment growth.
THE BOTTOM LINE - Our forecast is based on a mechanical input of data. This approach works 99.9% of the time, but a black swan event still unfolding does not create the proper trends where one can accurately forecast. All that is known for sure is that there are a lot of unknowns ahead. Stay safe.
Note that the majority of the graphics auto-update. The words are fixed on the day of publishing, and therefore you might note a conflict between the words and the graphs due to new data and/or backward data revisions.
The graph below plots GDP (which has a bias to the average - not median - sectors) against the Econintersect Economic Index (which has a bias to median).

This post will summarize the:
- special indicators,
- leading indicators,
- predictive portions of coincident indicators,
- review of the technical recession indicators, and
- interpretation of our own index - Econintersect Economic Index (EEI) - which is built of mostly non-monetary "things" that have been shown to be indicative of the direction of the Main Street economy at least 30 days in advance.
- our six-month employment forecast.
Special Indicators:
The consumer is not spending all of their income - the ratio between spending and income is below the average of the levels seen since the Great Recession.
Seasonally Adjusted Spending's Ratio to Income (an increasing ratio means Consumer is spending more of Income)

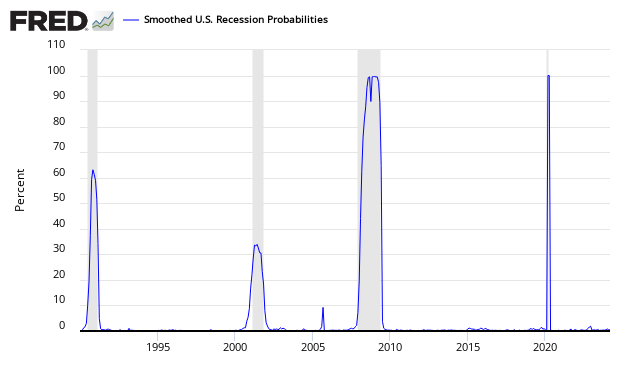
The St. Louis Fed produces a Smoothed U.S. Recession Probabilities Chart which finally is giving an indication of a recession.
Smoothed recession probabilities for the United States are obtained from a dynamic-factor markov-switching model applied to four monthly coincident variables: non-farm payroll employment, the index of industrial production, real personal income excluding transfer payments, and real manufacturing and trade sales. This model was originally developed in Chauvet, M., "An Economic Characterization of Business Cycle Dynamics with Factor Structure and Regime Switching," International Economic Review, 1998, 39, 969-996. (http://faculty.ucr.edu/~chauvet/ier.pdf)
Sahm Recession Indicator signals the start of a recession when the three-month moving average of the national unemployment rate (U3) rises by 0.50 percentage points or more relative to its low during the previous 12 months.

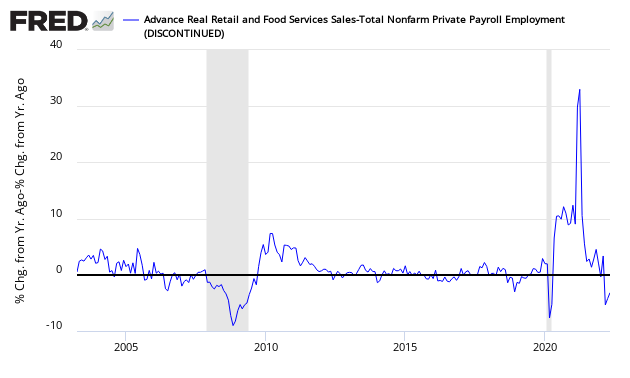
Econintersect reviews the relationship between the year-over-year growth rate of non-farm private employment and the year-over-year real growth rate of retail sales. This index has returned to positive territory. When retail sales grow faster than the rate of employment gains (above zero on the below graph) - a recession is not imminent. However, this index has many false alarms.
Growth Relationship Between Retail Sales and Non-Farm Private Employment - Above zero suggests economic expansion
GDPNow
The growth rate of real gross domestic product (GDP) is the headline view of economic activity, but the official estimate is released with a delay. Atlanta's Fed GDPNow forecasting model provides a "nowcast" of the official estimate prior to its release. Econintersect does not believe GDP is a good tool to view what is happening at Main Street level - but there are correlations.
Latest estimate: -51.2 percent — May 29, 2020
The GDPNow model estimate for real GDP growth (seasonally adjusted annual rate) in the second quarter of 2020 is -51.2 percent on May 29, down from -40.4 percent on May 28. After this morning's Advance Economic Indicators report from the U.S. Census Bureau and personal income and outlays release from the U.S. Bureau of Economic Analysis, the nowcast of second-quarter real personal consumption expenditures growth decreased from -43.3 percent to -56.5 percent and the nowcast of the contribution of change in real net exports to second-quarter real GDP growth decreased from 2.07 percentage points to 0.73 percentage points.

Nowcast
The New York Fed also has introduced its own economic projection called Nowcast. Its current forecast:
May 29, 2020: New York Fed Staff Nowcast
- The New York Fed Staff Nowcast stands at -35.5% for 2020:Q2.
- News from this week's data releases decreased the nowcast for 2020:Q2 by 5.0 percentage points.
- Negative surprises from manufacturing and wholesalers' inventories, and consumption data drove most of the decrease.

A yield curve inversion historically has been an accurate predictor of an impending recession. A yield curve inversion is where short term bonds have a higher yield than longer-term bonds. The graph below shows inversions prior to USA recessions. Econintersect does not believe the yield curve is a reliable indicator of recessions in the New Normal where monetary policy uses extraordinary tools. [And in any event, there can be no warning signs for an imminent black swan event].

Special Indicators Conclusion:
Most economic releases are based on seasonally adjusted data which are revised for months after issuance. The real trends in a particular release may not be obvious for many months due to data gathering and seasonality adjusting methodologies. The special indicators finally in this forecast are showing a recession.
The Leading Indicators:
The leading indicators are for the most part monetary based. Econintersect's primary worry in using monetary-based methodologies to forecast the economy is the accommodative monetary policy which may (or may not) be affecting historical relationships.
Econintersect does not use data from any of the leading indicators in its economic index. Leading indices in this post look ahead six months - and are all subject to backward revision.
Chemical Activity Barometer (CAB) - The CAB is an exception to the other leading indices as it leads the economy by two to fourteen months, with an average lead of eight months. The CAB is a composite index that comprises indicators drawn from a range of chemicals and sectors. It is a relatively new index and appears somewhat accurate (but its real-time performance is unknown - you can read more here). A value above zero is suggesting the economy is expanding.

ECRI's Weekly Leading Index (WLI) - A positive number shows an expansion of the business economy, while a negative number shows contraction. The methodology used in creating this index is not released but is widely believed to be monetary based.
Current ECRI WLI Index [high-frequency index]

The New York Fed's Weekly Leading Index (WLI) - A positive number shows an expansion of the business economy, while a negative number shows contraction.

The Aruoba-Diebold-Scotti Business Conditions Index - A positive number shows an expansion of the business economy, while a negative number shows contraction.

The Conference Board's Leading Economic Indicator (LEI) - the LEI has historically begun contracting well before a recession but has had many false contractions.

Leading Indicators Conclusion: We are in a recession
- Chemical Activity Barometer (CAB) shows the economy is likely in a recession.
- ECRI's WLI is now forecasting a recession.
- The Conference Board (LEI) shows the economy is likely in a recession.
- The New York Fed's Weekly Leading Index (WLI) shows the economy is in a recession
- The Aruoba-Diebold-Scotti Business Conditions Index shows the economy is in a recession.
Forward-Looking Coincident and Lagging Indicators
Here is a run-through of the most economically predictive coincident indices which Econintersect believes can give up to a six-month warning of an impending recession - and do not have a history of producing false warnings. Econintersect does not use any of these indicators in its economic forecast.
Consider that every recession has different characteristics and dynamics - and a particular index may not contract during a recession, or start contracting after the recession is already underway.
Truck transport portion of employment - to search for impending recessions. Look at the year-over-year zero growth line. For the last two recessions, it has offered a six-month warning of an impending recession with only one false warning. Transport is an economic warning indicator because it moves goods well before final retail sales occur. Until people stop eating or buying goods, transport will remain one of the primary economic pulse points. When this sector turns robotic in the coming years - this measure will become useless - but currently, the shift from box stores to e-Commerce is creating much more employment in this sector. Either way - this index may not be capable of alerting the next recession.
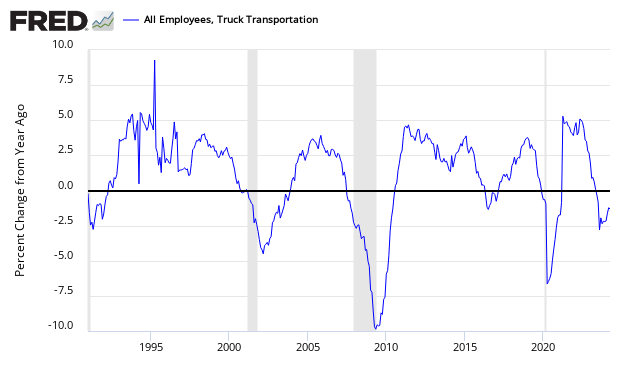
Transport employment growth is deeply in contraction. Normally, transport provides a six-month recession warning - the implication is that any possible recession is six months away.
Business Activity Markit US Services Activity Index - this index is noisy. The index is now below 50 (below 55 is a warning that a recession might occur, whilst below 50 is almost proof a recession is underway). This index may not provide timely warnings of recessions.

US Treasury Tax Receipts - For the Great Recession, the rolling averages went negative in February 2008 - two months after the Great Recession's start. For the 2001 recession, the rolling averages for tax revenues went negative two months after the official start of the recession. Currently, the year-over-year rolling average growth is down -28.5 % year-over-year - down from last month's +8.3 %.
Year-over-Year Change in US Government Receipts - Monthly (blue line) and Three Month Rolling Average (red line)

Predictive Coincident Index Conclusion: The predictive indices are also finally realizing a recession is underway.
Technical Requirements of a Recession
Sticking to the current technical recession criteria used by the NBER:
A recession is a significant decline in economic activity spread across the economy, lasting more than a few months, normally visible in real GDP, real income, employment, industrial production, and wholesale-retail sales. A recession begins just after the economy reaches a peak of activity and ends as the economy reaches its trough. Between trough and peak, the economy is in an expansion. Expansion is the normal state of the economy; most recessions are brief and they have been rare in recent decades.
... The committee places particular emphasis on two monthly measures of activity across the entire economy: (1) personal income less transfer payments, in real terms and (2) employment. In addition, we refer to two indicators with coverage primarily of manufacturing and goods: (3) industrial production and (4) the volume of sales of the manufacturing and wholesale-retail sectors adjusted for price changes.
Below is a graph looking at the month-over-month change (note that multipliers have been used to make changes more obvious).
Month-over-Month Growth Personal Income minus transfer payments (blue line), Employment (red line), Industrial Production (green line), Business Sales (orange line)
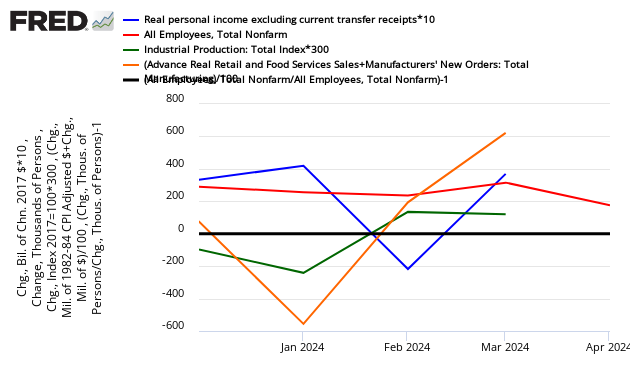
In the above graph, if a line falls below the 0 (black line) - that sector is contracting from the previous month. Most elements are in negative territory. Another way to look at the same data sets is in the graph below which uses indexed real values from the trough of the Great Recession.
Indexed Growth Personal Income minus transfer payments (red line), Employment (green line), Industrial Production (blue line), Business Sales (orange line)
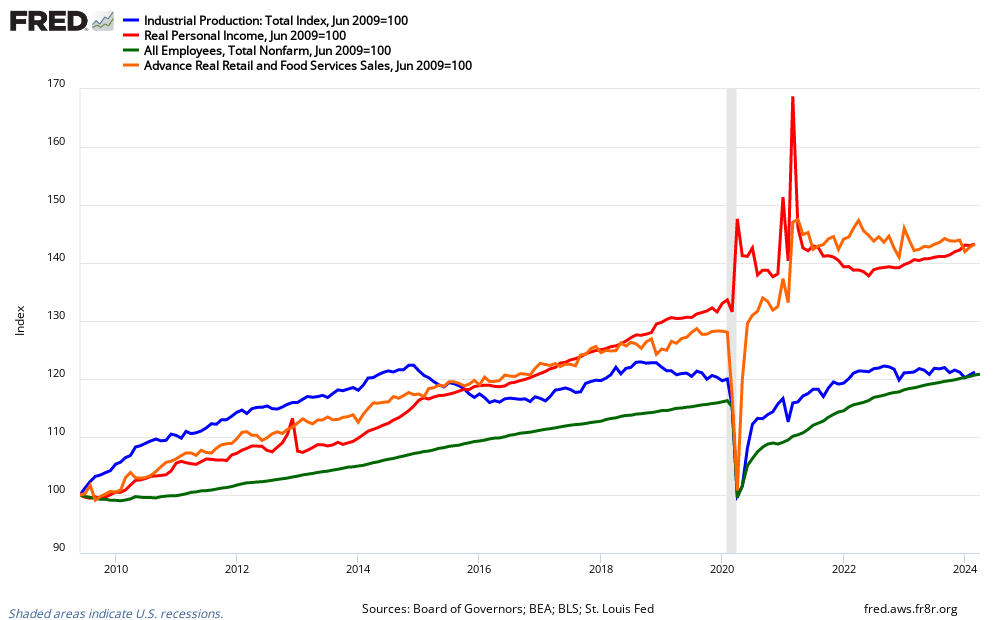
NBER Recession Marker Bottom Line - this month the indicators are flashing a recession is underway - except for personal income which reflects the stimulus payments sent to its citizens.
Econintersect believes that the New Nrmal economy has different dynamics than most economic models are using.
Economic Forecast Data
The Econintersect Economic Index (EEI) is designed to spot Main Street and business economic turning points. This forecast is based on the index's three-month moving average. The three-month rolling index value is now a negative 0.27 - an improvement from last month's -0.34. The economic forecast is based on the 3-month moving average as the monthly index is very noisy. A positive value of the index represents Main Street's economic expansion. Readings below +0.4 indicate a weak economy, while readings below 0.0 indicate contraction.
A summary of elements affecting our economic index:
- The government portion relating to business and Main Street are little changed even with the stimulus.
- The business portion recovered marginally from last month's crash.
- The consumer portion rate of growth again significantly declined.
The EEI is a non-monetary based economic index that counts "things" that have shown to be indicative of the direction of the Main Street economy. Note that the Econintersect Economic Index is not constructed to mimic GDP (although there are correlations, the turning points may be different), and tries to model the economic rate of change seen by business and Main Street. The vast majority of the inputs to this index uses data not subject to backward revision.

The red line on the EEI is the 3 month moving average.
Consumer and business behavior (which is the basis of the EEI) either lead or follow old fashion industrial age measures such as GDP depending on the primary dynamic(s) driving the economy. The Main Street sector of the economy lagged GDP in entering and exiting the 2007 Great Recession.
As Econintersect continues to backcheck its model, from time-to-time slight adjustments are made to the data sets and methodology to align it with the actual coincident data. To date, when any realignment was done, there have been no changes for trend lines or recession indications. Most changes to date were to remove data sets that had unacceptable backward revisions, became too volatile, or were discontinued. The last realignment was done in the June 2016 forecast to swap an industrial production data set which became too volatile. Documentation for this index was in the October 2011 forecast.
Jobs Growth Forecast
The Econintersect Jobs Index is forecasting non-farm private jobs contraction of 275,000 for June - significantly than last month's forecast of 50,000.
Summary of Jobs Forecast
The fundamentals which lead job growth are now showing a significantly slowing growth trend in the employment growth dynamics. The model used to create employment growth is smoothed - and it will take a few months for our employment forecast to catch up with this black swan pandemic.

The Econintersect Jobs Index is based on economic elements that create jobs, and (explanation here) measures the historical dynamics which lead to the creation of jobs. It measures general factors, but it is not precise (quantitatively) as many specific factors influence the exact timing of hiring. This index should be thought of as a measurement of job creation pressures.
For the last year, job growth year-over-year (green line in below graph) is bouncing around. The forecast by the Econintersect Jobs Index is shown as the blue line in the below graph. A fudged forecast (red line in below graph) is based on the deviation between forecast & current actual using a 3-month rolling average.

The fudge factor (based on the deviation between the BLS actual growth and the Econintersect Employment Index over the last 3 months) would project jobs contraction of 3,600,000
Analysis of Economic Indicators:
Econintersect analyzes all major economic indicators. The table below contains hyperlinks to posts. The right column "Predictive" means this particular indicator has a leading component (usually other than the index itself) - in other words, it has a good correlation to future economic conditions.
General Economic Indicators:
Monthly Data: {click here to view full screen}
Quarterly Data: {click here to view full screen}
Aruoba-Diebold-Scotti Business Conditions Index: {click here to view full screen}
Disclaimer: No content is to be construed as investment advise and all content is provided for informational purposes only.The reader is solely responsible for determining whether any investment, ...
more

