
Jittery Risk Sentiment, ECB Next Catalyst
The State of Affairs in Financial Markets
I’ll start the day analyzing, as usual, the RORO (risk-on risk-off) conditions in the marketplace, even if we must keep at the top of our minds that is Central Bank day, with the ECB next in line to update its monetary policy outlook following the ‘Fed Put’ by Chairman Powell earlier last year.
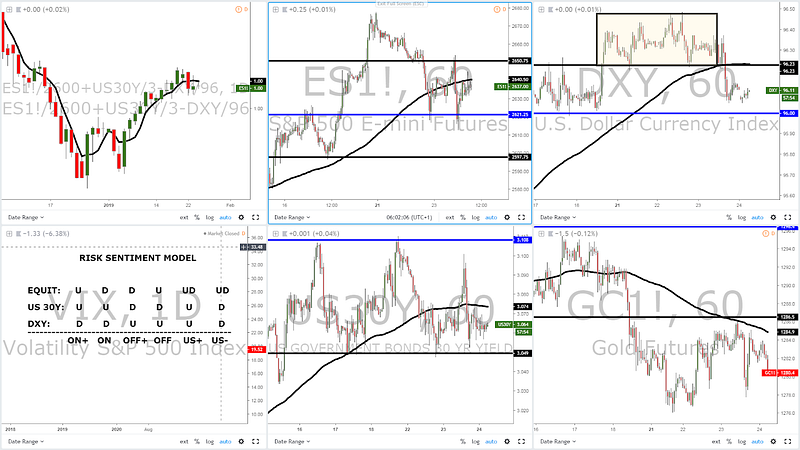
The price action in the RWI (risk-weighted index) is by far the most unstable and jittery it’s been this year, with a big red sell-off candle followed by a topside rejection, which has led to the 5-DMA to start flattening its upward slope since the double bottom found earlier in the year.
By looking at the individual components of the RWI on a 60-minute perspective, we’ve seen back-to-back sell off days in the ES, an indication that supply is returning. Notice both pushes were characterized by impulsive movements. The cluster of bids circa 2,630.00 is still keeping the upside potential intact, even if the 60-minute structure has now shifted into a consolidation mode. The same profile can be observed via the long-dated US 30-year bond yield, stuck in a 5bp range.
What’s arguably keeping the environment from a ‘by the book’ risk-off mode are not only the limited downward moves in US equities and US yields for now, but the breakout lower in the DXY, which has obviously been a positive for the likes of EMs, the Chinese Yuan and the overall sentiment.
The main takeaway, as noted on Wednesday, is that all the signals I’d require to be more convinced of a further deterioration in risk sentiment are yet to line up. If the ES can find equilibrium sub 2,630 on a daily closing basis and US money markets see further demand, combined with the roll over of the 5-DMAs, that will start to make investors nervous to sell risk. If on top of this assumption, a recovery in Gold prices ensued by a break above the 1,286.50 resistance on a daily closing basis, you should start playing much more defensive, with the usual suspects (JPY, CHF, USD) in demand.
Daily Chart Insights — Trading Opportunities
EUR/USD — Finds Demand Off Lows Ahead Of ECB
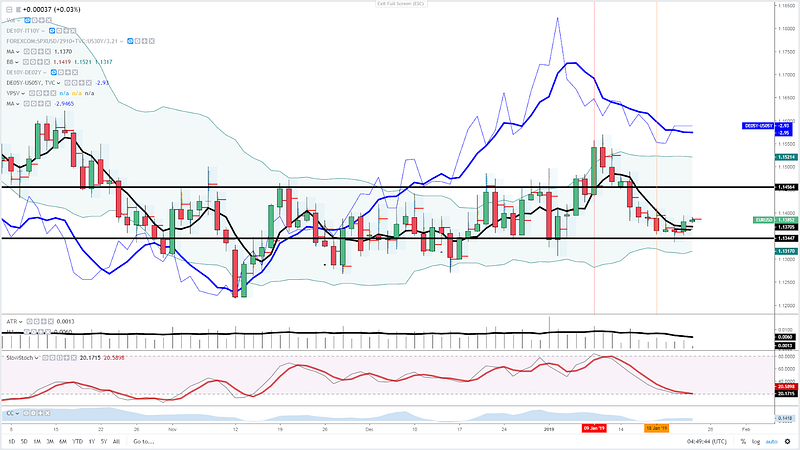
The pair found demand off a critical swing low at 1.1345–50, which one could cross reference to see how relevant it’s been on the most recent price interactions (Dec 24 low, Jan 2 low). The flattening of the 5-DMA at a time when the slow stochastic is entering an overbought territory is another sign that the tide of sell-side commitment may have matured, especially in the context of such a rotation market profile for the last few months. Add into the mix that the German vs US 5-year bond yield spread as proxy of the capital flows entering EMU, US continues to show macro divergence, and one could make a case that justifies buying EUR weakness from the low levels it bounced off this week.
GBP/USD — Another Milestone After 1.30 Resolution
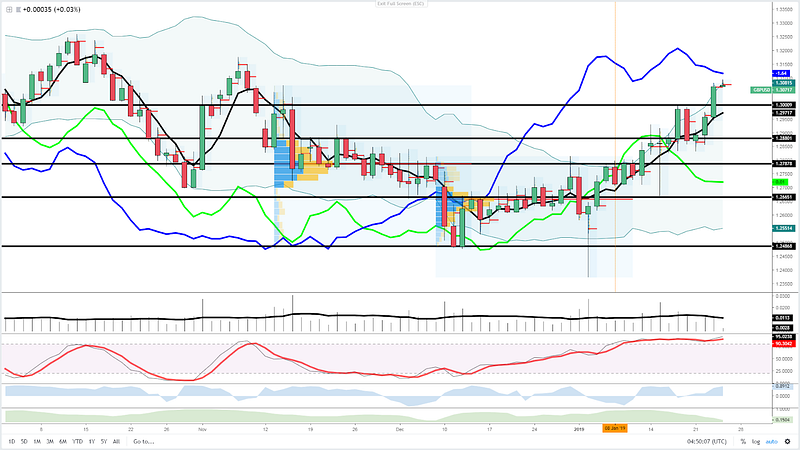
If there were any doubts about the current market’s darling, look no further than the perky Sterling. The resolution above the 1.30 round number is yet another major milestone as overly short hedges to protect against a hard Brexit are coming to terms about the new reality sets in with the worst-case ‘hard Brexit’ scenario rapidly fading away as a tail risk in one’s portfolio. The liquidation of short hedge structures, improved UK data, and Brexit heading into a potential 2nd referendum, have all resurrected the Sterling in a very strong fashion. Just be aware that the current rise appears to be fairly overextended, especially if one takes as reference the recent USD strength, as shown in a green line in the chart, alongside some tapering in the UK vs US bond yield spread. Play the overextended rally with caution if trading off higher time frames. If engaging in short-term plays, the bullish momentum is really strong, so fighting this trend won’t be for the faint-hearted.
USD/JPY — Finds A Wall At 110.00 Round Number
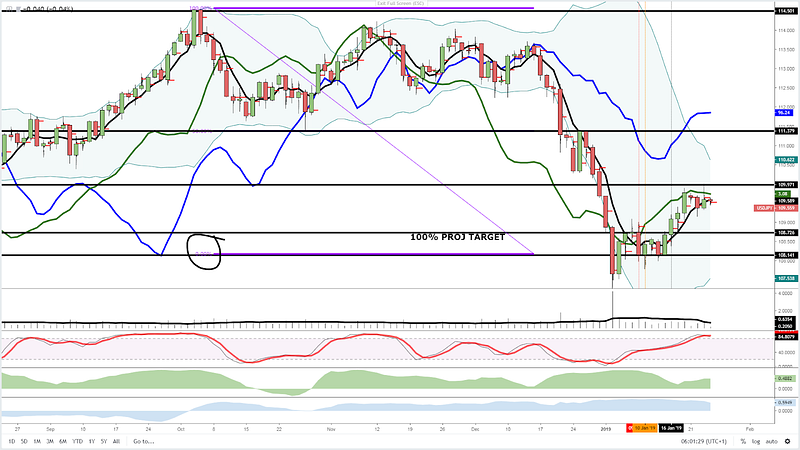
The up move came to an abrupt halt on Wednesday following the test of a major macro area of resistance at 110.00. The daily analysis does not offer a clear bias to take, as we need to contend with a clear topside wick rejection in the context of a still ascending 5-DMA slope. The picture gets even muddier when we factor in the downward sloping tendencies in the 5-DMA in the US long-dated 30y US bond yield, which as we show in green, has been extremely correlated with USD/JPY. Even the DXY (in blue) is starting to carve out a potential top based on its 5-DMA measures. Overall, the indicators are far from clear until new catalysts are present, which may be just around the corner with the ECB policy meeting to stimulate risk conditions. The area between 109.00 and 110.00 should cover the short-term eventualities.
Important Footnotes
- Risk model: The fact that financial markets have become so intertwined and dynamic makes it essential to stay constantly in tune with market conditions and adapt to new environments. This prop model will assist you to gauge the context that you are trading so that you can significantly reduce the downside risks. To understand the principles applied in the assessment of this model, refer to the tutorial How to Unpack Risk Sentiment Profiles
- Cycles: Markets evolve in cycles followed by a period of distribution and/or accumulation. The weekly cycles are highlighted in red, blue refers to the daily, while the black lines represent the hourly cycles. To understand the principles applied in the assessment of cycles, refer to the tutorial How To Read Market Structures In Forex
- POC: It refers to the point of control. It represents the areas of most interest by trading volume and should act as walls of bids/offers that may result in price reversals. The volume profile analysis tracks trading activity over a specified time period at specified price levels. The study reveals the constant evolution of the market auction process. If you wish to find out more about the importance of the POC, refer to the tutorial How to Read Volume Profile Structures
- Tick Volume: Price updates activity provides great insights into the actual buy or sell-side commitment to be engaged into a specific directional movement. Studies validate that price updates (tick volume) are highly correlated to actual traded volume, with the correlation being very high, when looking at hourly data. If you wish to find out more about the importance tick volume, refer to the tutorial on Why Is Tick Volume Important To Monitor?
- Horizontal Support/Resistance: Unlike levels of dynamic support or resistance or more subjective measurements such as fibonacci retracements, pivot points, trendlines, or other forms of reactive areas, the horizontal lines of support and resistance are universal concepts used by the majority of market participants. It, therefore, makes the areas the most widely followed and relevant to monitor. The Ultimate Guide To Identify Areas Of High Interest In Any Market
- Trendlines: Besides the horizontal lines, trendlines are helpful as a visual representation of the trend. The trendlines are drawn respecting a series of rules that determine the validation of a new cycle being created. Therefore, these trendline drawn in the chart hinge to a certain interpretation of market structures.
- Correlations: Each forex pair has a series of highly correlated assets to assess valuations. This type of study is called inter-market analysis and it involves scoping out anomalies in the ever-evolving global interconnectivity between equities, bonds, currencies, and commodities. If you would like to understand more about this concept, refer to the tutorial How Divergence In Correlated Assets Can Help You Add An Edge.
- Fundamentals: It’s important to highlight that the daily market outlook provided in this report is subject to the impact of the fundamental news. Any unexpected news may cause the price to behave erratically in the short term.
- Projection Targets: The usefulness of the 100% projection resides in the symmetry and harmonic relationships of market cycles. By drawing a 100% projection, you can anticipate the area in the chart where some type of pause and potential reversals in price is likely to occur, due to 1. The side in control of the cycle takes profits 2. Counter-trend positions are added by contrarian players 3. These are price points where limit orders are set by market-makers. You can find out more by reading the tutorial on The Magical 100% Fibonacci Projection
The Daily Edge is authored by Ivan Delgado, Head of Market Research at Global Prime. The purpose of this content is to provide an assessment of the market conditions. The report takes an in-depth ...
more

