
USD/JPY Technical Outlook: Neutral
USD/JPY recorded a drop of about 0.5% last week after prices fell 1% on Friday. Earlier in the week, the cross lost steam around the psychologically significant 150 level. The 26-day Exponential Moving Average (EMA) underpinned prices several times throughout the week. On Wednesday, an intraday attempt failed to break below the 23.6% Fibonacci retracement from the May/October move. That level may come back into focus soon.
While the uptrend remains intact, a Descending Triangle pattern puts a bearish tilt on the chart. A daily close below the triangle’s support—aligned closely with the 23.6% Fib level—would clear a path lower, but prices would first need to dispatch the 26-day EMA. If that occurred, the pattern’s measured move puts a target around the 100-day Simple Moving Average (SMA). Intermediate support from the 38.2% Fib, which held up price action throughout September, may disrupt price action.
Alternatively, USD/JPY would challenge the 150 psychological level on a break above triangle resistance. That is also a level thought to represent the Bank of Japan’s line in the sand for intervening in the market. The Relative Strength Index (RSI) trended sideways last week but held above its midpoint. Overall, the path of least resistance is biased to the downside, although conflict exists for both sides to play.
USD/JPY Daily Chart
(Click on image to enlarge)
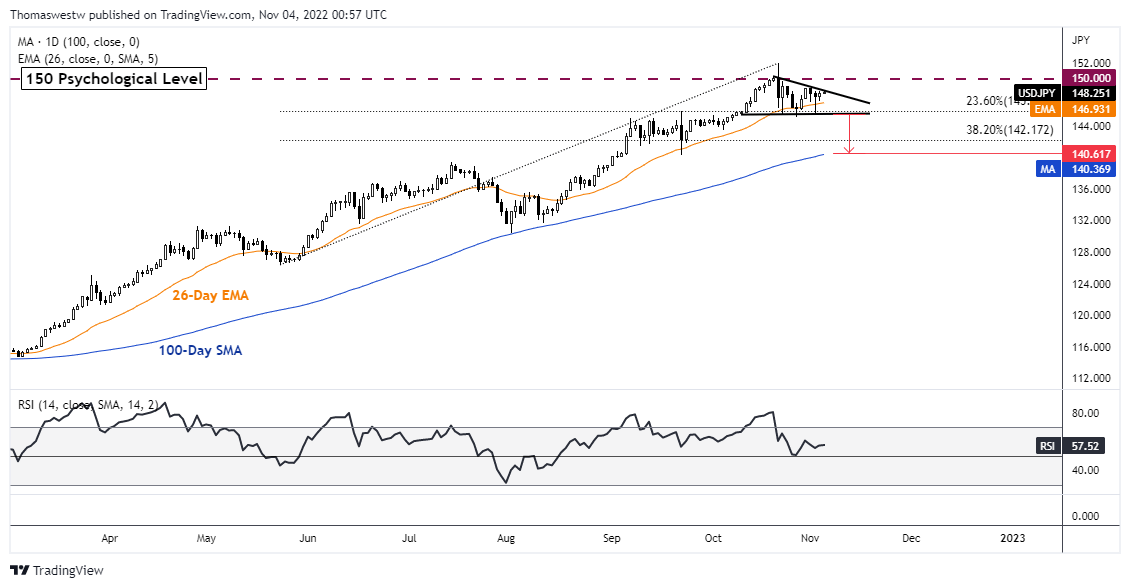
Chart created with TradingView
CHF/JPY Technical Outlook: Bearish
CHF/JPY broke below a supportive trendline from May in a decisive move that pierced through the 50-day SMA. On the weekly timeframe, the RSI crossed below the 70 overbought level, reflecting the sudden momentum change. The daily RSI fell below the oscillator’s midpoint. The breakdown comes after several months of probing around the 150 level.
Prices then moderated at the 23.6% Fibonacci retracement from the May/September move. A break lower would target the 100-day SMA, which braced action several times earlier this year. The short-term outlook is dispositioned lower, given the trendline break. Still, a period of consolidation above the Fib level is another possibility.
CHF/JPY Daily Chart
(Click on image to enlarge)
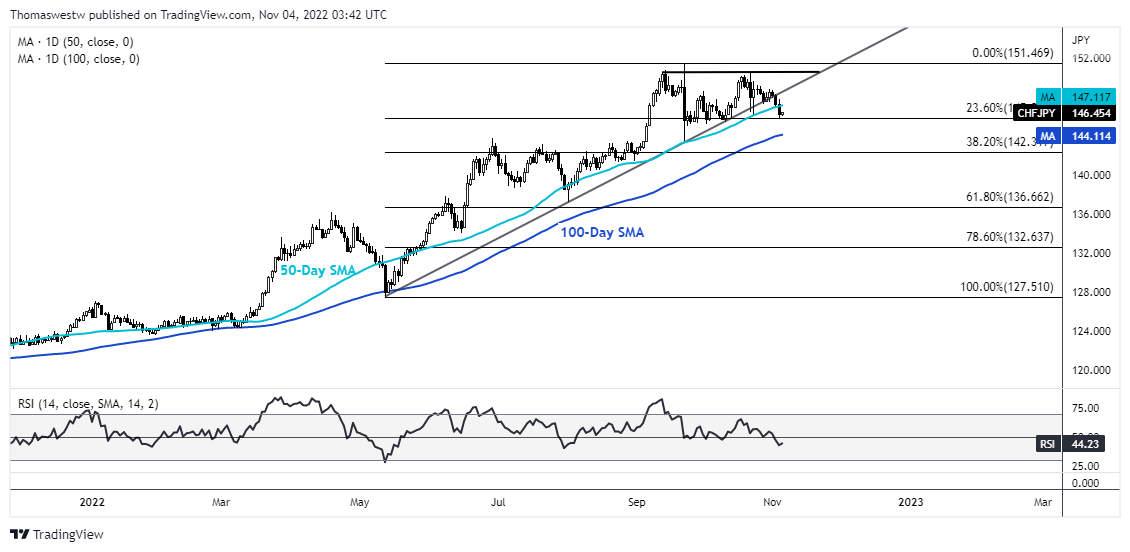
Chart created with TradingView
AUD/JPY Technical Outlook: Bullish
AUD/JPY recorded its third weekly gain after prices surged nearly 2% on Friday. A Linear Regression Channel from the late 2021 swing low revealed that prices briefly moved outside a two standard deviation distance, which generally contains around 95% of price action. A move outside the channel signals a buy signal for traders, with an assumption that prices should gravitate back toward the regression line. That said, AUD/JPY should have more room to climb.
AUD/JPY Daily Chart
(Click on image to enlarge)
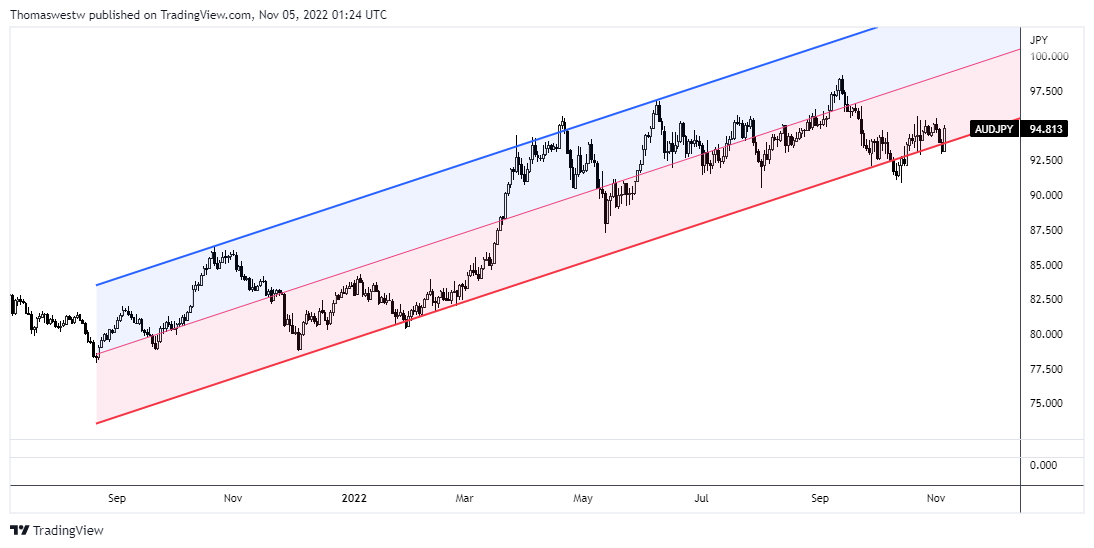
Chart created with TradingView
More By This Author:
Japanese Yen Fundamental Outlook: USD/JPY Turns to US Inflation Report
Canadian Dollar Forecast: Hawkish BoC And Strong Jobs Data Should Keep The Loonie On The Front Foot
Australian Dollar Outlook: Wings Clipped By The RBA


Comments
Log in or sign up to join the conversation.