
Japanese ETF And Constantinople Boost Cryptos – Levels
The first full week of 2019 is in full swing and markets are on the move. The US Securities and Exchanges Commission (SEC) may take its time with approving a Bitcoin ETF and is stuck due to the government shutdown. However, Japanese regulators are contemplating an Exchange Traded Fund for the grandaddy of cryptocurrencies: Bitcoin.
Satoshi Nakamoto’s coin (may it be a Japanese individual or a group of developers outside Japan) is celebrating its 10th birthday, and an ETF would be a nice gift. Our charts show it has room to move one step up.
Another positive factor is Ethereum’s Constantinople upgrade. The consensual hard-fork is due for January 16th, and the current King of Altcoins holds onto its gains. Can it push higher? It may need to unshackle itself from a tough area of resistance.
What about Ripple? The third cryptocurrency in market capitalization is surrounded by technical barriers, but the path of least resistance is to the upside.
(Click on image to enlarge)
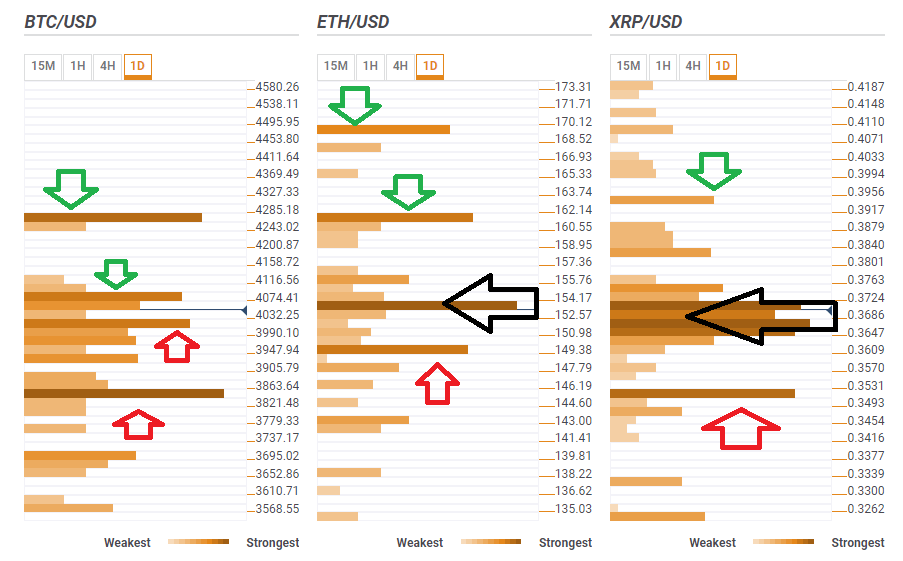
BTC/USD has a clear upside target
Bitcoin has an initial resistance line at $4,074 which is the convergence of the Simple Moving Average 5-15m, the Pivot Point one-day Resistance 2, the Bollinger Band 15m-Upper, the PP 1w-R2, and the Fibonacci 161.8% one-day.
The upside target is around $4,265 which is the meeting point of last month’s high, the PP 1w-R3, and the PP 1m-R1.
Looking down, BTC/USD has immediate support at $4,010 where we see the Fibonacci 23.6% one-day, the SMA 50-15m, the Fibonacci 38.2% one-day, the BB 1h-Middle, the SMA 10-1h, the SMA 5-4h, and the SMA 100-15m.
Significant support awaits at $3,840 where we see the confluence of the SMA 50-4h, the SMA 200-1h, the Fibonacci 61.8% one-month, the SMA 10-1d, and the BB 1d-Middle.
ETH/USD needs to escape the $153 magnet
Ethereum is stuck around $153 which is a magnet for Vitalik Buterin’s brainchild. It is a dense cluster of lines including the Fibonacci 38.2% one-day, the previous 4h high, the SMA 10-15m, the SMA 100-1h, the Fibonacci 23.6% one-week, and the Bollinger Band 4h-Middle.
Should it rise, the next level to watch is $161.20 where the PP 1d-R3, the BB 4h-Upper, and last monthly high converge.
Further up, $170 is the target as it is the meeting point of the BB 1d-Upper and the PP 1m-R1.
Support awaits at $149.30 which is the confluence of the Fibonacci 382.% one-week and previous 4h low.
XRP/USD mired in the range
Ripple is stuck in a dense forest of technical levels ranging from $0.3647 to $0.0.3724. These woods include the SMA 100-4h, the previous 1h-high, the BB 15-minute Upper, the Fibonacci 61.8% one-week, the SMA 5-1h, the SMA 10-1d, the SMA 10-15m, the BB 1d-Middle, the Fibonacci 61.8% one-day, the SMA 5-15m, the SMA 200-1h, the Fibonacci 38.2% one-day, the BB 15m-Middle, the all-important Fibonacci 23.6% one-day, the SMA SMA 50-4h, the SMA 10-4h, and many more.
If XRP/USD breaks free, an initial target is $0.3956 where we note the Fibonacci 61.8% one-month.
On the downside, substantial support awaits at $0.3513 which is the confluence of the Fibonacci 38.2% one-month and last week’s low.
As resistance is weaker than support, the bulls may have a better chance to rise.
Disclaimer: Foreign exchange (Forex) trading carries a high level of risk and may not be suitable for all investors. The risk grows as the leverage is higher. Investment objectives, risk appetite and ...
more

