
January 2019 Residential Building Mixed Improved
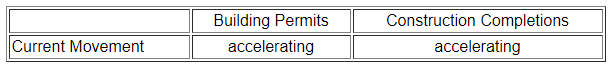
The headline residential building permits improved and construction completions improved relative to last month. But we keep our eyes on the rolling averages which did improve.

Analyst Opinion of Residential Building
The backward revisions this month were significant especially for construction completions. The nature of this industry normally has large variations from month to month (mostly due to weather) so the rolling averages are the best way to view this series.
Overall, 2018 permits and completions were higher than 2017.
We consider this report better than last month - but because of all the backward revisions it is hard to understand if this really is true.
Over time, there is little difference between using permits or starts to compare to completions. Note that this month housing starts improved relative to last month.
Looking at residential construction employment, the year-over-year growth of employment has a reasonable correlation with housing starts.
(Click on image to enlarge)

- Unadjusted Construction completions are lower than permits - meaning the sector is expanding..
- Unadjusted 3 month rolling averages for permits (comparing the current averages to the averages one year ago) is +2.2 % (permits) and -6.7 % (construction completions):
3 month Rolling Average for Year-over-Year Growth Unadjusted Data
(Click on image to enlarge)
(Click on image to enlarge)

Econintersect Analysis:
- Unadjusted Building permits growth decelerated 2.2 % month-over-month, and is up 0.2 % year-over-year.
- Unadjusted Single family building permits is down 7.1 % year-over-year.
- Unadjusted Construction completions accelerated 23.4 % month-over-month, up 3.3 % year-over-year.
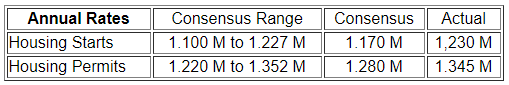
- building permits up 1.4 % month-over-month, down 1.5 % year-over-year
- construction completions up 27.6 % month-over-month, up 2.1 % year-over-year.
- the market expected (from Econoday):
(Click on image to enlarge)
Note that Econintersect analysis herein is based on UNADJUSTED data - not the headline seasonally adjusted data.
When more building permits are issued than residences completed - the industry is expanding. In the graph below, any value above zero shows more permits are being issued than completions.
Difference Between New Home Building Permits and Construction Completions (unadjusted)
(Click on image to enlarge)
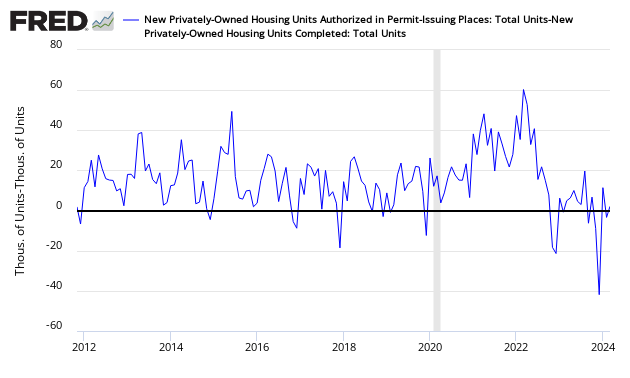
Although the data is noisy - the trends vary depending on the periods selected - but the short term trends show slowing in this sector.
Unadjusted Year-over-Year Change New Homes - Permits (blue line) and Construction Completions (red line)
(Click on image to enlarge)

Other points to take away from the data:
-
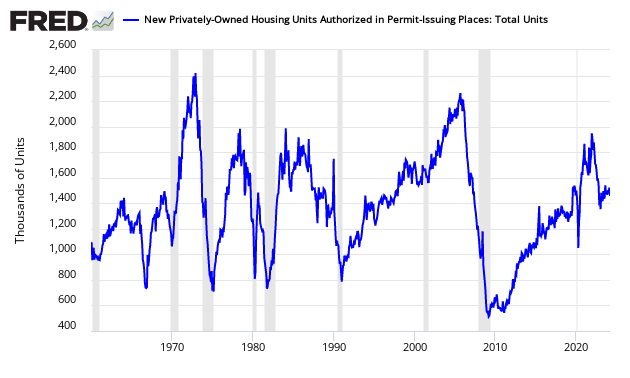
Before we start thinking all is well, the residential home industry is less than half of the pre-2005 peak.
Seasonally Adjusted Residential Building Permits
(Click on image to enlarge)
-
Apartments accounted for 37.2 % of all building permits.
Unadjusted Ratio Apartment Permits (structures with 5 or more units) to Total Permits - a higher number means more Apartments
(Click on image to enlarge)

Caveats on the use of Building Permits Data
This is a non-monetary index. There is a significant revision. Per US Census:
In interpreting changes in the statistics in this release, note that month-to-month changes in seasonally adjusted statistics often show movements which may be irregular. It may take 3 months to establish an underlying trend for building permit authorizations, 6 months for total starts, and 5 months for total completions. The statistics in this release are estimated from sample surveys and are subject to sampling variability as well as nonsampling error including bias and variance from response, nonreporting, and undercoverage. Estimated relative standard errors of the most recent data are shown in the tables. Whenever a statement such as "2.5 percent (±3.2%) above" appears in the text, this indicates the range (-0.7 to +5.7 percent) in which the actual percent change is likely to have occurred. All ranges given for percent changes are 90-percent confidence intervals and account only for sampling variability. If a range does not contain zero, the change is statistically significant. If it does contain zero, the change is not statistically significant; that is, it is uncertain whether there was an increase or decrease. The same policies apply to the confidence intervals for percent changes shown in the tables. On average, the preliminary seasonally adjusted estimates of total building permits, housing starts and housing completions are revised about three percent or less. Explanations of confidence intervals and sampling variability can be found on our web site listed above.
This sector expands when more housing permits are issued than houses completed. The data is not necessarily accurate in real time, however. For 2011, there were more building permits than construction completions (total over a complete year) for the first year since 2005.
- 2005 = 225K more permits than construction completions
- 2006 = 140K more construction completions than permits
- 2007 = 104K more construction completions than permits
- 2008 = 214K more construction completions than permits
- 2009 = 211K more construction completions than permits
- 2010 = 47K more construction completions than permits
- 2011 = 39K more permits than construction completions
- 2012 = 181K more permits than construction completions
- 2013 = 227K more permits than construction completions
- 2014 = 168K more permits than construction completions
- 2015 = 210K more permits than construction completions
- 2016 = 114K more permits than construction completions
- 2017 = 101K more permits than construction completions
- 2018 = 135K more permits than construction completions
This data in this series is created by the survey - not by hard data:
-
Permits - A monthly survey of 9,000 selected permit-issuing places; and an annual census of an additional 11,000 permit places that are not in the monthly sample. The monthly sample of permit-issuing places was selected using a stratified systematic procedure. All permit places located in selected large metropolitan areas were selected with certainty. The remaining places were stratified by state. Places that exceed a cutoff value, which varies by state, were selected with certainty. Remaining places were sampled at a rate of 1 in 10.
-
Construction Completions - To provide nationwide coverage of building activity, a multi-stage stratified random sample procedure was used to select approximately 900 building permit-issuing offices, and a sample of more than 70 land areas not covered by building permits. Each month, for permit-issuing places, a sample of residential building permits is selected from each of the sampled permit offices. The probability of selecting a permit is proportional to the number of units authorized by the permit. Permits for one-to-four-unit buildings are sampled at an overall rate of 1 in 50. All permits authorizing buildings with 5 or more housing units in the sampled permit offices are selected. Each month, for areas that do not require building permits, field representatives conduct a road canvass in each of the sampled non-permit land areas to identify the start of new buildings. All new residential buildings found are selected for the survey. Once a permit or building is selected, a field representative contacts the owner or builder, by telephone or in person, to conduct the interview each month as necessary. Contact continues until the project is either completed or abandoned. If a single-family home is not sold by the time of completion, the project will continue to be followed until the sale occurs. Each month, interviews are required for about half of the buildings currently being followed up. Each month, housing starts, completions, and sales estimates derived from this survey are adjusted by the total numbers of authorized housing units (obtained from the Building Permits Survey) to develop national and regional estimates. Estimates are adjusted to reflect variations by region and type of construction, and to account for late reports and houses started or sold before a permit has been issued. Reported data are seasonally adjusted. Monthly estimates are made for all permit-issuing places nationwide. If a survey report is not received, missing data on permits for new construction are imputed except for places that are also selected for the Survey of Construction (SOC). For these places, SOC permit data are used. We request assistance from State Data Centers to encourage jurisdictions to respond.
The US Census uses a multi-year methodology to seasonally adjust their data. Econintersectuses a simpler year-over-year analysis to seasonally adjust the data - the fear being that a major depression, government interference (incentives) in the housing markets, and other new normal effects are distorting the historical multi-year reference data.
Econintersect determines the month-over-month change by subtracting the current month's year-over-year change from the previous month's year-over-year change. This is the best of the bad options available to determine month-over-month trends - as the preferred methodology would be to use multi-year data (but the New Normal effects and the Great Recession distort historical data).
Disclaimer: No content is to be construed as investment advise and all content is provided for informational purposes only.The reader is solely responsible for determining whether any investment, ...
more

