January 2019 Kansas City Fed Manufacturing Again Declined
Of the four regional manufacturing surveys released for January, all were in expansion except one with most growth rates slowing.

Analyst Opinion of Kansas City Fed Manufacturing
Kansas City Fed manufacturing has been one of the more stable districts and their index is now well below the range seen in the last 12 months. Note that the key internals declined with new orders barely in expansion and backlog now deeply in contraction. This is a much worse report than last month.
There were no market expectations from Econoday. The reported value was 3. Any value below zero is a contraction.
(Click on image to enlarge)
The Federal Reserve Bank of Kansas City released the January Manufacturing Survey today. According to Chad Wilkerson, vice president and economist at the Federal Reserve Bank of Kansas City, the survey revealed that Tenth District manufacturing activity continued to grow modestly, and expectations for future growth remained solid. "Regional factories had another month of sluggish growth in January," said Wilkerson. "About one-sixth of the firms in the survey said the partial government shutdown had negatively affected their business."
Tenth District manufacturing activity continued to grow modestly in January, and expectations for future growth remained solid. The month-over-month finished goods price index rose, while the raw materials price index edged lower. Price expectations for the next six months held steady.
The month-over-month composite index was 5 in January, similar to 6 in December, and lower than 17 in November. The composite index is an average of the production, new orders, employment, supplier delivery time, and raw materials inventory indexes. The slow and steady increase in factory activity was driven by durable goods producers, particularly wood products, fabricated metals, electrical equipment and appliances, and furniture manufacturing. Month-over-month indexes were somewhat mixed. The production index jumped back into positive territory, while the order backlog index turned negative for the first time since June 2017. Most year-over-year factory indexes eased from the previous month, and the composite index decreased from 38 to 31. Future factory activity expectations remained solid. The future composite index eased slightly from 22 to 18, while the future production index increased.
Summary of all Federal Reserve Districts Manufacturing:
Richmond Fed (hyperlink to reports):
(Click on image to enlarge)
Kansas Fed (hyperlink to reports):
(Click on image to enlarge)
Dallas Fed (hyperlink to reports):
(Click on image to enlarge)
Philly Fed (hyperlink to reports):
(Click on image to enlarge)
New York Fed (hyperlink to reports):
(Click on image to enlarge)
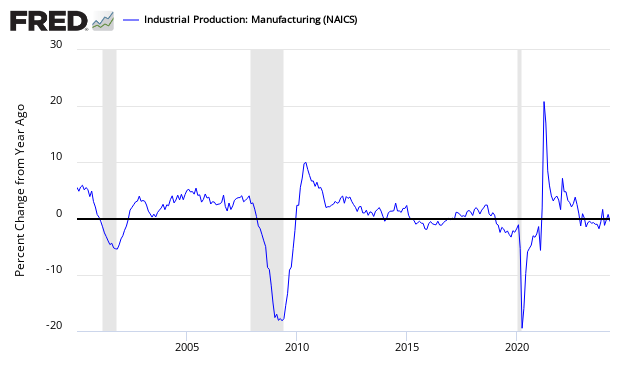
Federal Reserve Industrial Production - Actual Data (hyperlink to report):
(Click on image to enlarge)

Holding this and other survey's Econintersect follows accountable for their predictions, the following graph compares the hard data from Industrial Products manufacturing subindex (dark blue bar) and US Census manufacturing shipments (lighter blue bar) to the Kansas City Fed survey (light green bar).
Comparing Surveys to Hard Data:
(Click on image to enlarge)

In the above graphic, hard data is the long bars, and surveys are the short bars. The arrows on the left side are the key to growth or contraction.
Disclaimer: No content is to be construed as investment advise and all content is provided for informational purposes only.The reader is solely responsible for determining whether any investment, ...
more


