
January 2019 ISM And Markit Services Indices Decline
The ISM non-manufacturing (aka ISM Services) index and the Markit PMI Services Index continued their growth cycle but declined.

Analyst Opinion of the ISM and Markit Services Survey
Both services surveys are in expansion - but declined this month.
From Econoday:
(Click on image to enlarge)
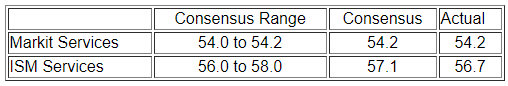
Joint-weakest rise in new business since October 2017
- Rate of new order growth matches December's recent low
- Activity expansion softest in four months
- Price pressures ease to 22-month low
- January data signalled a further upturn in business activity across the service sector. The rise in output was the slowest for four months, amid one of the softest increases in new business seen for more than a year. Although only fractional, new export orders fell for the second successive month. In line with a slower rise in new business, employment growth eased to the second-weakest since June 2017. However, firms registered a stronger degree of confidence towards business activity levels over the coming 12 months.
- The seasonally adjusted final IHS Markit U.S. Services Business Activity Index registered 54.2 in January, down slightly from 54.4 in December. Anecdotal evidence linked the solid rise in business activity to a sustained increase in new orders and greater client demand. That said, the rate of expansion was the softest for four months and weaker than both the series trend and the average seen in 2018
(Click on image to enlarge)

Economic activity in the non-manufacturing sector grew in January for the 108th consecutive month, say the nation's purchasing and supply executives in the latest Non-Manufacturing ISM® Report On Business®.
The report was issued today by Anthony Nieves, CPSM, C.P.M., A.P.P., CFPM, Chair of the Institute for Supply Management® (ISM®) Non-Manufacturing Business Survey Committee: "The NMI® registered 56.7 percent, which is 1.3 percentage points lower than the December reading of 58 percent. This represents continued growth in the non-manufacturing sector, at a slower rate. The Non-Manufacturing Business Activity Index decreased to 59.7 percent, 1.5 percentage points lower than the December reading of 61.2 percent, reflecting growth for the 114th consecutive month, at a slower rate in January. The New Orders Index registered 57.7 percent, 5 percentage points lower than the reading of 62.7 percent in December. The Employment Index increased 1.2 percentage points in January to 57.8 percent from the December reading of 56.6 percent. The Prices Index increased 1.4 percentage points from the December reading of 58 percent to 59.4 percent, indicating that prices increased in January for the 20th consecutive month. According to the NMI®, 11 non-manufacturing industries reported growth. The non-manufacturing sector's growth rate cooled off in January. Respondents are concerned about the impacts of the government shutdown but remain mostly optimistic about overall business conditions."
The 11 non-manufacturing industries reporting growth in January — listed in order — are: Transportation & Warehousing; Health Care & Social Assistance; Mining; Accommodation & Food Services; Wholesale Trade; Finance & Insurance; Utilities; Real Estate, Rental & Leasing; Construction; Professional, Scientific & Technical Services; and Public Administration. Seven non-manufacturing industries reported contraction in January in the following order: Retail Trade; Educational Services; Information; Agriculture, Forestry, Fishing & Hunting; Arts, Entertainment & Recreation; Management of Companies & Support Services; and Other Services.
ISM Services Index
(Click on image to enlarge)

There are two sub-indexes in the ISM Services which have good correlations to the economy - the Business Activity Index and the New Orders Index - both have good track records in spotting an incipient recession - both remaining in territories associated with expansion.
This index and its associated sub-indices are fairly volatile.
- The Business Activity sub-index declined 1,5 points and now is at 59.7
- The New Orders Index declined 5.0 and is currently at 57.7
The complete ISM manufacturing and non-manufacturing survey table is below.
(Click on image to enlarge)

Econintersect does give serious consideration to this survey as the service sector accounts for 80% of the economy and 90% of employment. However, this an opinion survey and is not hard data.
Caveats on the use of ISM Non-Manufacturing Index:
This is a survey, a quantification of opinion. However, as pointed out above, certain elements of this survey have good to excellent correlation to the economy for as long as it has been in existence. Surveys lead hard data by weeks to months and can provide early insight into changing conditions.
The main ISM non-manufacturing index (NMI) is so new that it does not have enough data history to have reliable certainty about how it correlates to the economy. Again, two sub-indices (business activity and new orders) do have good correlation for the limited history available.
No survey is accurate in projecting employment - and the ISM Non-Manufacturing Employment Index is no exception. Although there are some general correlation in trends if you stand far enough back from this graph, month-to-month movements have not correlated well with the BLS Service Sector Employment data.
From Econoday:
The ISM non-manufacturing survey does not compile a composite index like its manufacturing cousin. The business activity index, which is actually akin to the production index in the manufacturing survey, is widely followed as the key figure from this survey.
Disclaimer: No content is to be construed as investment advise and all content is provided for informational purposes only.The reader is solely responsible for determining whether any investment, ...
more

