
IWM Short Interest Jumps To 9-Month High As Cracks Open Up In Russell 2K Momentum
IWM short interest rose to a nine-month high at the end of March. This could potentially help the longs should they succeed in squeezing the shorts. The problem is (1) the Russell 2000 has had a massive rally in the past year, and (2) technicals are worsening.
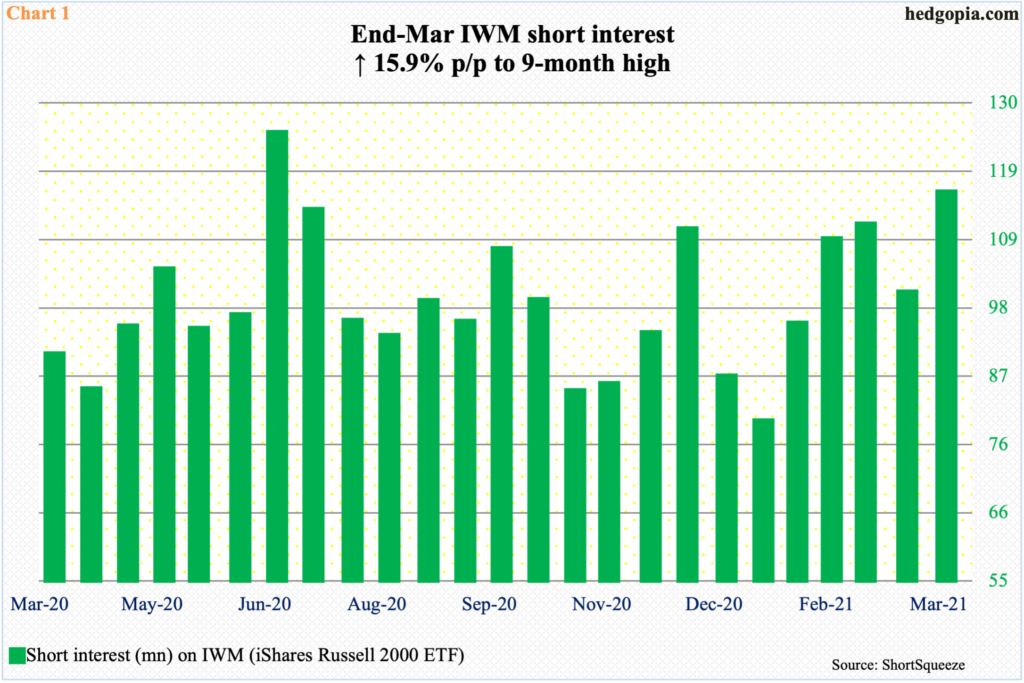
In the second half of March, short interest on IWM (iShares Russell 2000 ETF) jumped 15.9 percent period-over-period to 114.8 million shares. This is the highest since June-end last year when there were 124 million shares short (Chart 1).
Back then, there was a brief selloff in the first half of June, with the Russell 2000 tagging 1343.60 intraday on the 15th before turning up. Shorts provided help as they covered. Small-cap bulls are probably hoping for a similar outcome. Except there are two problems.
(1) Last June, the rally had just begun — essentially. In three out of four sessions through March 23, the Russell 2000 tested 960s before bottoming. The small-cap index then went on to rally 144 percent in a year, peaking at 2360.17 on March 15 this year. (2) Technicals are wobbly.
Even though the Russell 2000 (2228.92) bottomed in March, it was not until November it staged a major breakout. Small-caps had begun to find their feet around the time of the presidential election which was held on November 3. Then came Pfizer’s (PFE) positive vaccine announcement on the 9th; the Russell 2000 broke out of 1600-plus, which has been a level of interest for both bulls and bears going back to January 2018. A week later, on the 16th, Moderna (MRNA) announced similarly positive vaccine news; the index took out the 1740s, which was its prior high from August 2018.
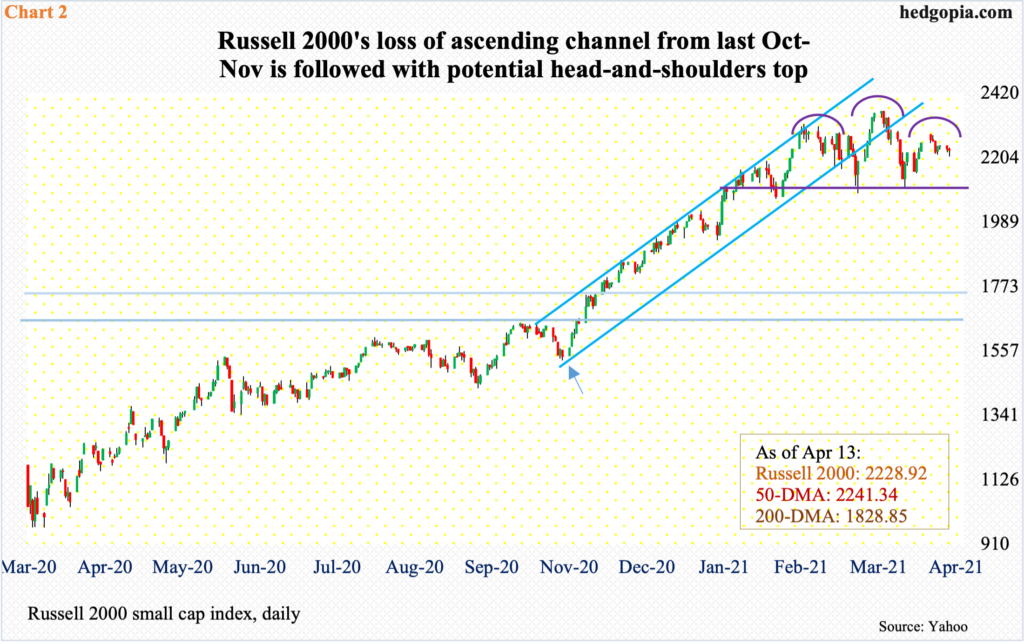
From last October-November, the Russell 2000 then traded within a sharply rising ascending channel (Chart 2). Investors gravitated toward the sector as optimism toward the economy grew. Real GDP this year is expected to grow in the six to seven percent range. This is now widely known. Small-caps are beginning to act as if this is in the price.
After peaking on March 15, the Russell 2000 has dropped out of the channel in question. Further, it seems to be forming the right shoulder of a potentially bearish head-and-shoulders pattern. The neckline lies at 2070s-2080s, which is six to seven percent from here. Bulls obviously hope this does not give way. And shorts could come to their aid, should they begin to cover. Once again, IWM short interest is at a nine-month high.
Amidst all this, small-cap companies are sending a mixed message.
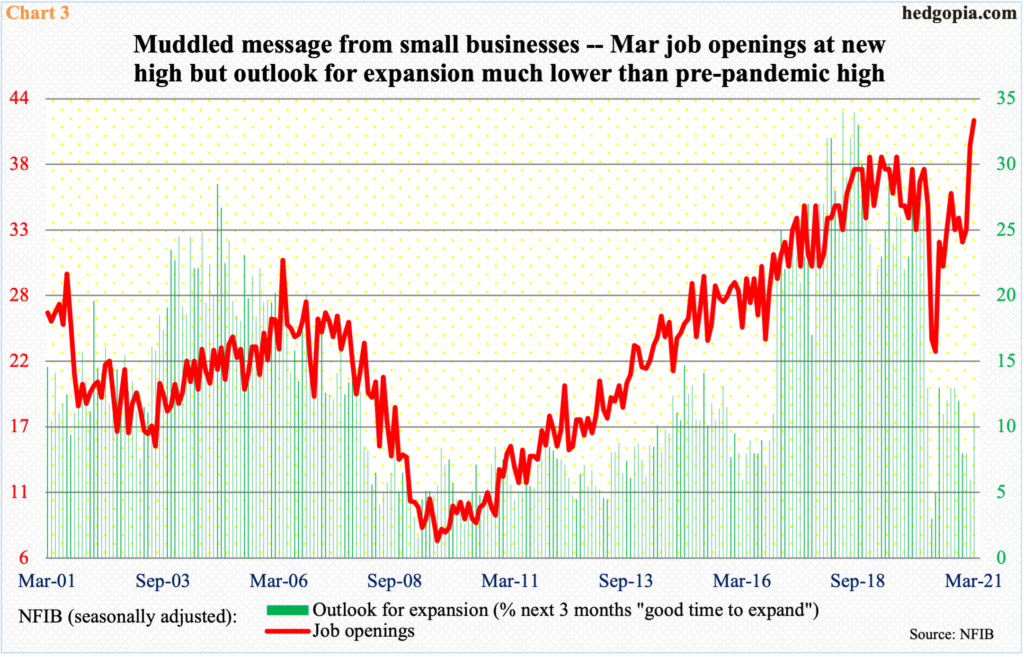
In March, the NFIB Optimism Index rose 2.4 points month-over-month to 98.2 – a four-month high. The job openings sub-index increased two points m/m to 42 – a new record; this was down to 23 last May and has recovered strongly.
But their outlook for expansion remains muted. March was up five points m/m to 11, but right before it cratered early last year it posted 28 in January and 26 in February. The divergence between job openings and expansion outlook is seen in Chart 3 and is very wide.
Depending on which is leading – job openings or expansion outlook – will decide the fate of small-cap stocks, which have already priced in a lot of good news.


