
Is The Worst Behind For Crude Oil Bears?
Crude oil made yesterday another hesitant move higher. Also yesterday, we mentioned here the saying regarding gravity. Sometimes, it takes patience for the underlying forces to win out. Or, doesn't the oil market rather remind you more of a coiled spring actually? Accordingly, what is the position favored most by the odds right now?
Let’s take a closer look at the charts below (charts courtesy of http://stockcharts.com).
(Click on image to enlarge)
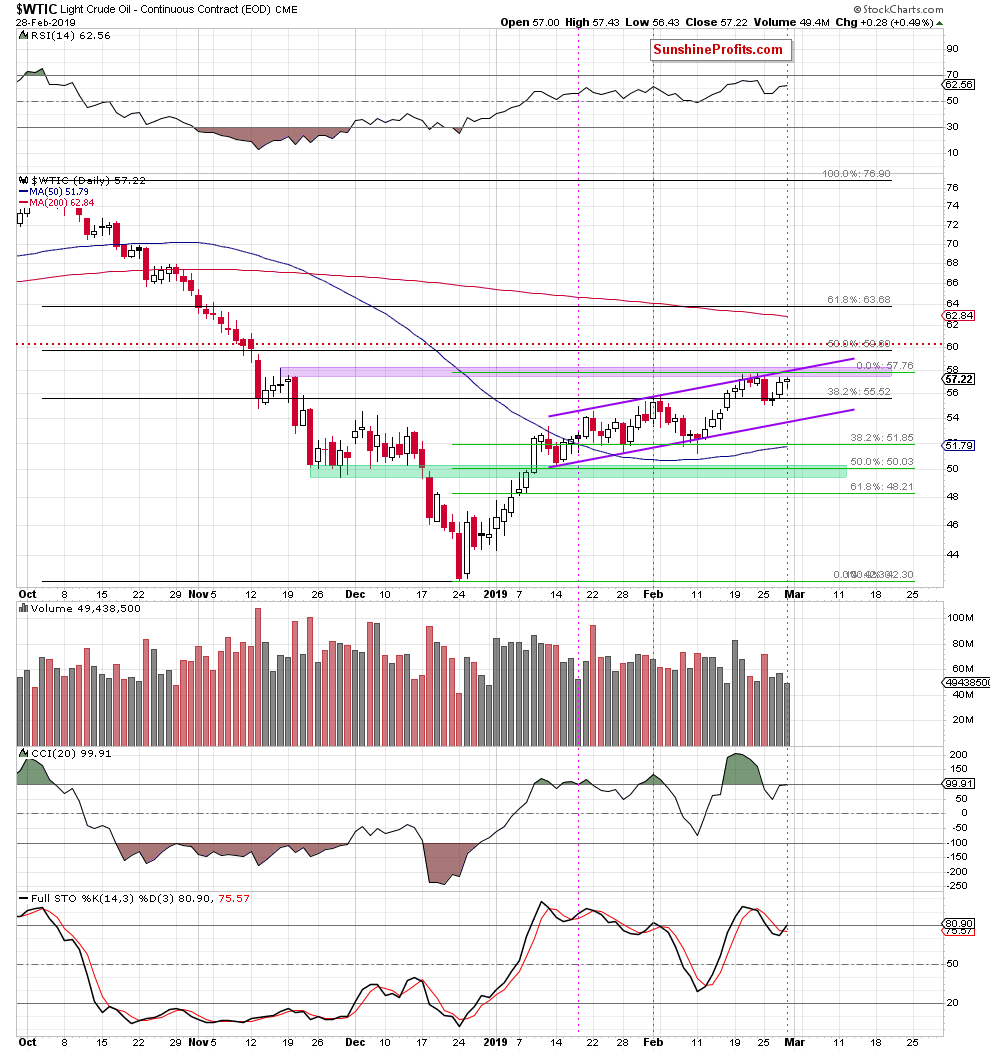
Looking at the daily chart, we see that the commodity is still trading below two nearest resistances: the upper border of the purple rising trend channel and the purple resistance zone. Just like you could read in our previous Oil Trading Alerts. Additionally, yesterday’s upswing materialized on smaller volume than a day earlier. Combined with yesterday’s price compression and today’s hesitation (upside move has again been rejected and black gold changes hands at around $56.25 currently), this further underlines buyers’ weakness.
Taking the above into account, we could summarize today’s alert with a simple sentence: nothing has changed from a technical point of view.
Not so fast.
Take a good look at the above chart once more. There is one potentially important change – the Stochastic Oscillator has generated its buy signal. How dependable is that actually?
We have seen two similar cases previously and they’re marked with pink vertical dotted lines. We see that the invalidation of the sell signal generated by this indicator preceded fresh peaks in the oil price. A close examination of such a superficially similar occurrence is therefore warranted.
Let’s take a look at the daily chart below once again, but this time from a bit different point of view.
(Click on image to enlarge)
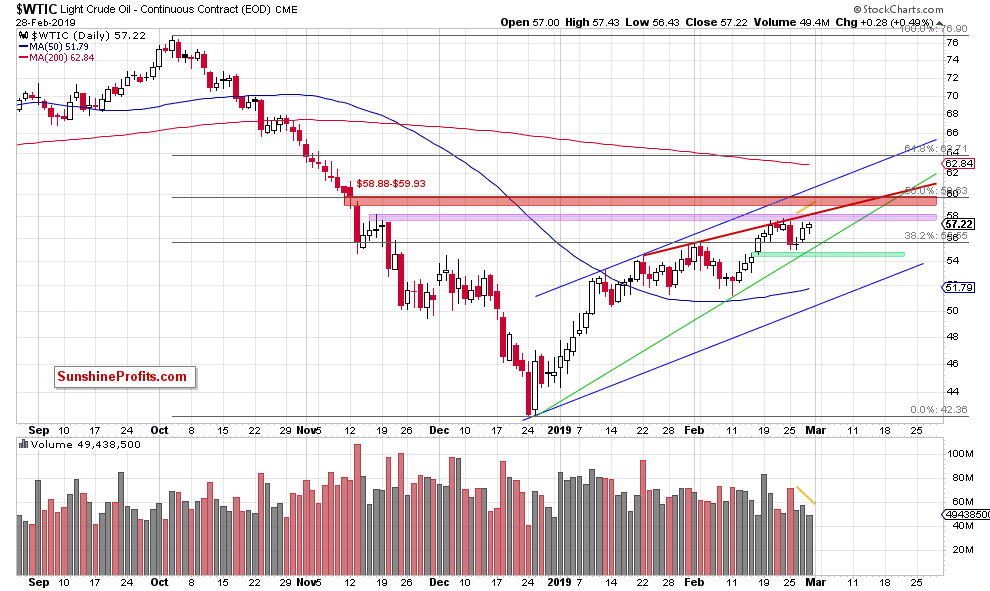
You can see that we have removed the above-mentioned purple rising trend channel. We have added these additional elements:
- The blue rising trend channel based on the peaks and the lows of the December-February upward move
- The red zone created by the gap between the November 12, 2018 candle and the following session, which serves as the next resistance
- The red resistance line based on the January 22, January 31 and early February peaks, which was strong enough to stop the oil bulls also in a week ago
- The green zone, created by the green gap between February 14 and the following session
- The green support line based on the late-December 2018 and February 11, 2019 lows, which together with the above mentioned green gap serves as the nearest supports for the oil price
Still, on the above chart, you can see that the 50% Fibonacci retracement (based on the entire October-December downward move) reinforces the strength and the importance of the red gap between $58.88 and $59.93.
For the sake of curiosity now, let’s explore another part of the analytical universe. It’s our habit to approach the markets using different toolboxes and present you with the clearest perspective possible. Everywhere, not only in Oil Trading Alerts. Let’s dive in.
Enjoy the journey of looking at the price movements through the optics of Elliott Wave technicians.
They would see this potential scenario for the coming week emerging.
(Click on image to enlarge)
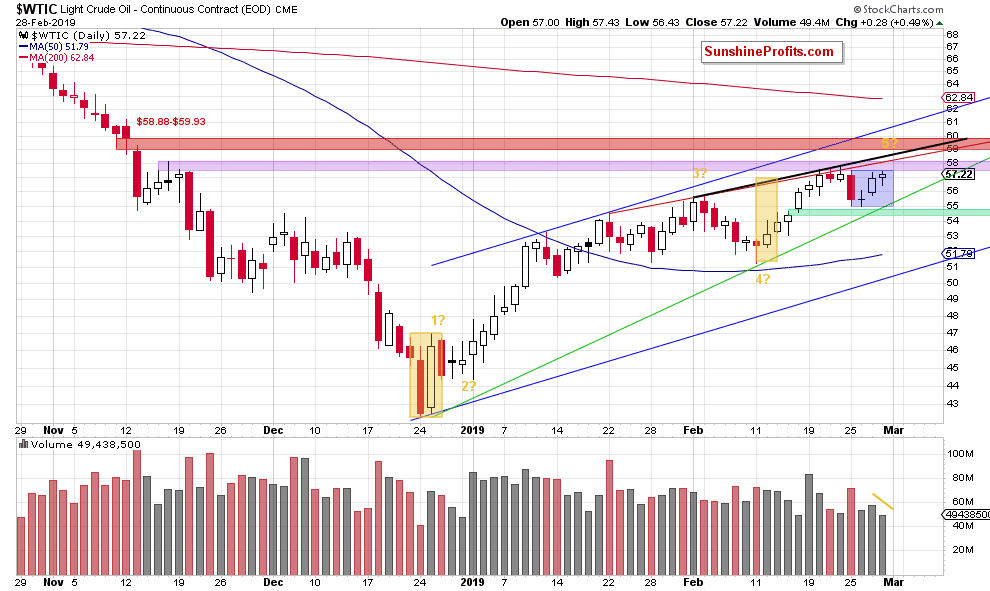
Note the two yellow rectangles which show that the upward move between the February 11 low and the last week’s peaks was quite similar to the first upward move after the December low.
Such price action suggests that we could observe the last impulse wave according to the Elliott Wave Theory. It says that the first and the fifth waves are quite similar (in our case not in time, but probably in the length). If this is the case, crude oil can still hit one more fresh peak, which will precede a bigger move to the downside.
Why is another fresh high possible?
If we correctly marked the waves of the upward December-February move, light crude is currently forming the fifth smaller wave within a bigger fifth (marked on the above chart with 5?) wave. In other words, if all the above assumptions are correct, the last peak is still ahead of us. One more note regarding the markings and assumptions – within Elliott Wave Theory, the wave counts and markings can change as the chart progresses to be in line with the underlying price action. The market decides – the waves structure, type, and precedence of waves.
How high can the commodity go?
Light crude can test the above-mentioned red resistance line, which currently intersects the upper border of the purple resistance zone. Here, the size of the fifth impulse wave would be equal to 150% of the first wave. Nevertheless, if this area is broken, the next target would be around $58.74, where the fifth wave would be equal to 161.8% of the first wave, which is slightly below the red gap.
What could happen next?
In our opinion, after a potential fresh peak, we’ll still see a drop to at least the green support line based on December and February lows, but it seems more likely to us that we’ll see a decline to around $51.23-$52.30, where the mid-February lows and the bottom of a potential fourth wave are.
If the situation develops in line with the above scenario, we’ll likely increase the size of our short position.


