
Is The VIX Sending A Warning Signal... Again?
Who believes in the latest equity market rally? After a month-long, near 7% S&P 500 drawdown/decline, the benchmark index has roared back nearly 4.5% in about 6 trading sessions. But what augers concern is the seemingly sanguine signal from the VIX. We’ll get to that in just a minute, but first…
The S&P 500 (SPX) rallied nicely above 2,900 on Monday before running into a brick wall and being abruptly turned back and trimming nearly 50% of its intraday gains. The S&P 500 still finished higher by nearly .50% on the day, which was surpassed by .61% Russell 2000 (RUT) and 1.05% Nasdaq (NDX) gains. The Dow Jones Industrial Average (DJIA) was the laggard on the day with a .30% gain.
What drove equity prices higher on Monday was the positive sentiment revealed by a “new deal” between the U.S. and Mexico that relieved the threat of tariffs on the country’s exports to the United States. But the deal did leave a sour taste in the mouth of economists, analysts and investors alike.
“The avoidance of Mexican tariffs is a positive but this wasn’t entirely unexpected and it doesn’t by any means erase the enormous risks inherent in Trump’s trade policies,” Adam Crisafulli, a J.P. Morgan managing director, said in a note on Monday.
Coupled with a positive trade headline that many are skeptical of, seeing how the two parties agreed to little more than efforts to reduce illegal migration and reviewing results over the coming 45 days, were two large merger and acquisition deals. Raytheon and United Technologies agreed to an all-stock merger that would create a combined company with $74 billion in annual sales. Salesforce.com announced its acquisition of big data company Tableau Software on Monday. The $15.3 billion all-stock deal marks the biggest purchase in the company’s history.
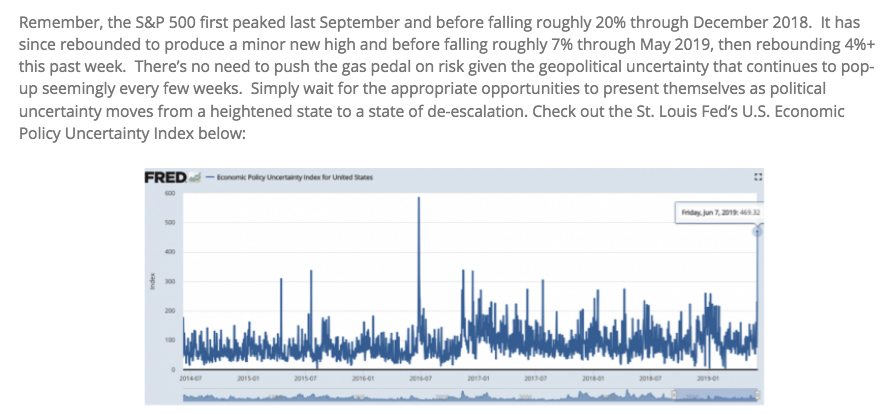
While M&A activity has accelerated in the last couple of months, so has economic policy uncertainty. In this past weekend’s Research Report, I outlined that policy uncertainty was at levels not seen since 2016 when the Brexit Vote took place and leading up to the U.S. Presidential election.
My thoughts and concerns were mirrored in a recent report from LPL Financial.
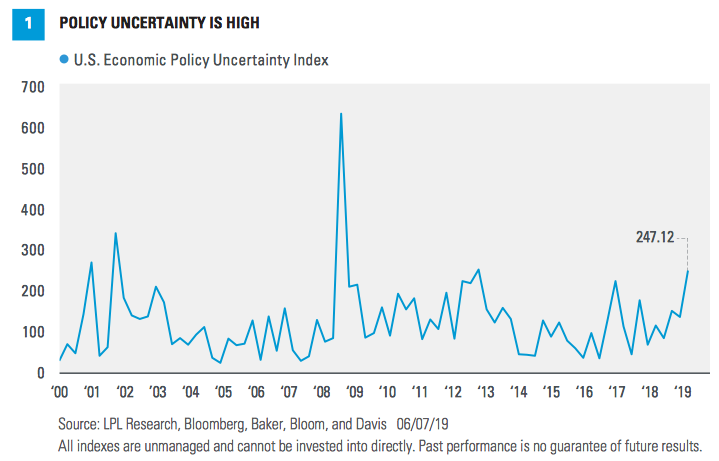
“We know policy uncertainty is high, but researchers have actually quantified it by creating a policy uncertainty index. The U.S. version of this index, which counts words in news stories associated with economic and Washington, D.C., policy and tracks them over time, is high—no surprise. The trade-policy-specific version of this index is similarly high and trending upward—no surprise there either. Our friends at Strategas Research Partners tell us that searches for “tariffs” on Bloomberg hit their highest level of President Trump’s presidency last week.”
It’s not just economic policy uncertainty that has weighed on the market and market participants, but the ongoing trade feuds have exacted their toll on the domestic and global economies. The so-called bond vigilantes have driven bond yields to their lows of the calendar year recently and found the 3-month Treasury yield inverting with the 10-year Treasury yield. Additionally, the long end of the Treasury yield has found itself below the Fed Funds Target Rate. Coupled with concerns over a protracted trade war, the market is pricing in a rate cut as early as July and 3 rate cuts in 2019. This is a sharp contrast to the former expectations of rate hikes in 2019. Here is what Morgan Stanley’s chief investment officer Lisa Shalett had to say about the rate policy “about face” in the last 6 months.
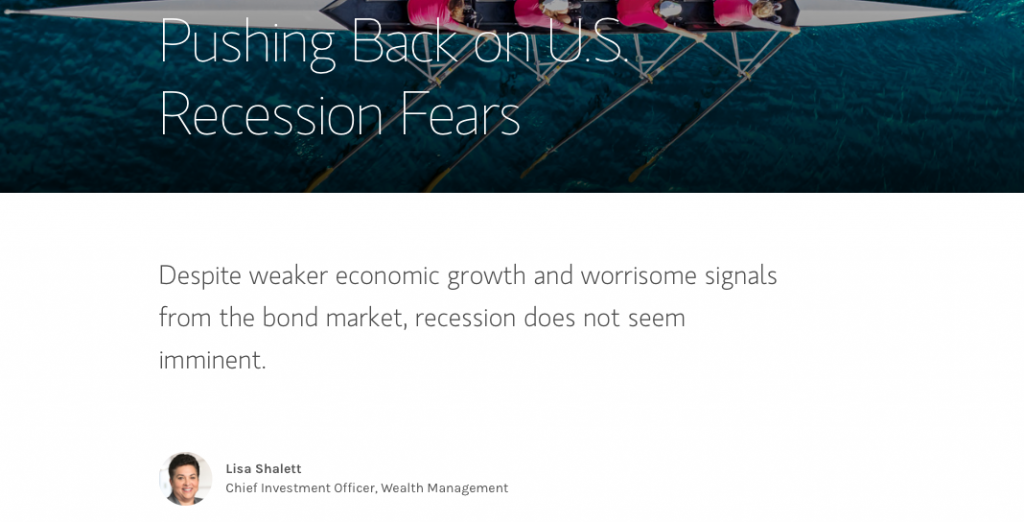
”In less than six months, investors have gone from discounting three Fed rate hikes to three cuts; many factors support the shift, but we question whether easing alone can change the outcome. While looser policy may support market liquidity and valuations in the short run, we are not confident that rate cuts can cure what ails the economy. All-time high consumer confidence, 50-year low unemployment and mortgage rates near 4% have not lifted consumption and residential investment; rather, policy uncertainty from Washington and geopolitical instability is weighing on the aging business cycle; trade uncertainty appears to be distorting supply chains, quashing capital spending and contributing to a manufacturing slowdown. If the Fed is ultimately pressured into “prophylactic rate cuts,” then it may find itself with too few bullets left when it really needs them, she added.
If the yield curve, economic uncertainty, and Fed rate cuts weren’t enough of an obstacle for market participants to hurdle over, there remain a few other unresolved concerns to come. Although it’s more than a year off, uncertainty surrounding the U.S. presidential election has begun to impact markets already, particularly healthcare stocks. Internationally, Brexit still has not been resolved, and Italy is again fighting with European regulators about its deficit spending. Combining all these factors together with recent weakening of economic data, LPL Financial has now reduced their earnings outlook for 2019.
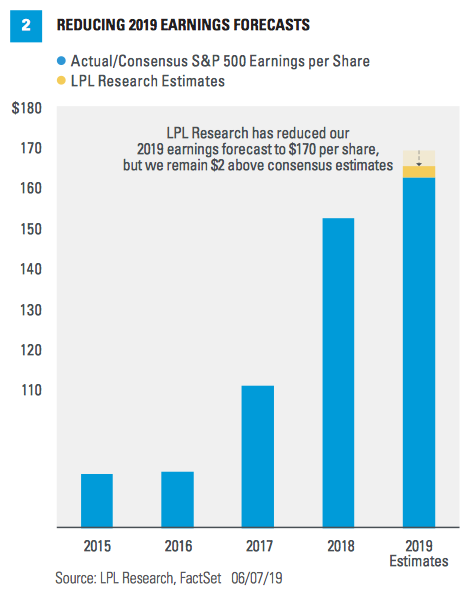
“We think a reasonable worst-case scenario for tariffs in 2019 is in the $8–10 range of S&P 500 earnings per share. That implies a three-month delay could be worth $2–2.50 per share. Factoring in tariffs, ongoing trade uncertainty, and the related drag on business confidence and economic growth, we are reducing our 2019 S&P 500 earnings forecast from $172.50 per share to $170.
We have not changed our year-end fair value target on the S&P 500 of 3,000. We expect a slightly lower earnings figure will be offset by a marginally higher price-to-earnings ratio.”
A manmade global crisis has filtered its way into the global economy and, in part, caused a global economic slowdown that may certainly impact the S&P 500 EPS going forward. The greatest impact to the global economy has been felt and seen in business investment and capital expenditures. This may prove to be just the tipping point in what has now been an 18-month wagered trade feud. While there may be some light at the end of the trade feud tunnel of bearish economic sentiment, it remains to be seen whether or not business investment will reaccelerate. Moreover and most importantly to investors is weather or not investors will reverse outflows from the market that have persisted since 2017.
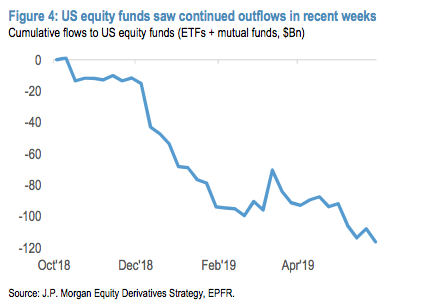
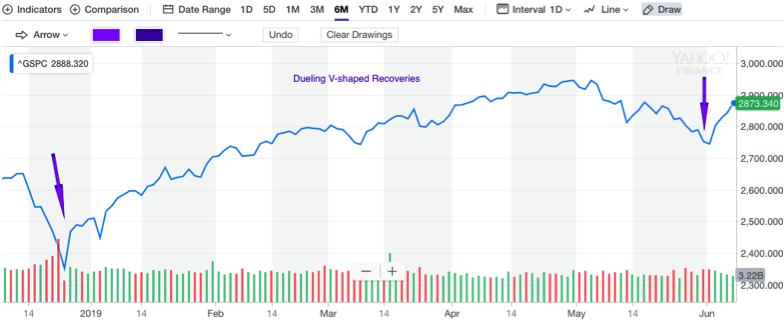
It has been a remarkable feat of strength to witness the market’s V-shaped recovery and successive record levels over the last 9 months in the face of such heavy outflows from the equity market and into the bond market. Additionally and somewhat equally remarkable has been the dual V-shaped recoveries in the face of extremely low market liquidity levels.
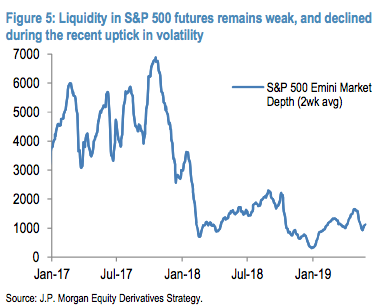
With respect to market liquidity, it is often noted that low levels of market liquidity are a danger to investors, as they serve to remove market efficiency. Recognizing this reality in the market liquidity paradigm, we are also forced to realize that liquidity dangers are aligned with market positioning. If long a market that is in a downtrend, the pain is no greater than if short a market that is up trending. Referring to our dueling V-shaped recoveries, to date the lack of market liquidity has favored the bulls.
With even the market bulls revising their earnings outlook lower, yet still above consensus, that brings us to the more bearish outlook from Morgan Stanley’s chief equity strategist Mike Stanley. Finom Group has written extensively on Wilson’s January-April 2019 market calls. (From January)
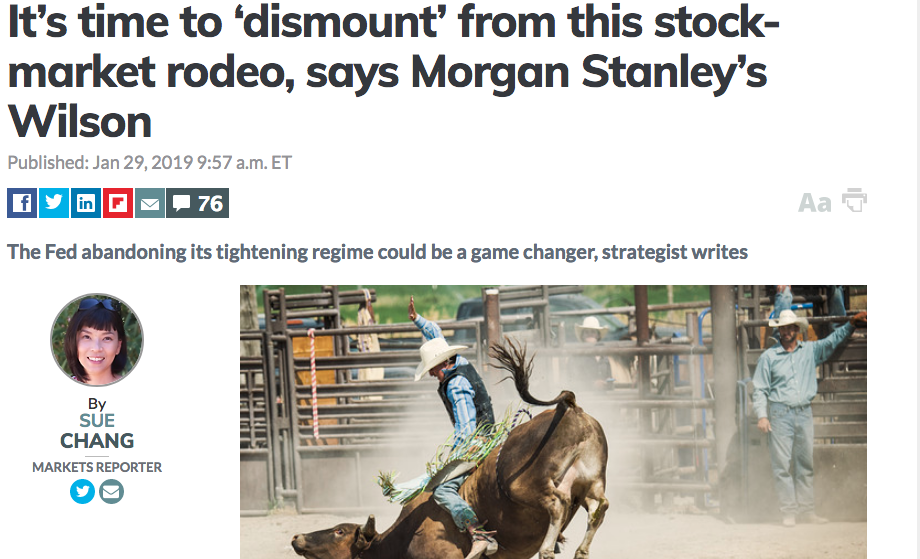
Wilson has urged investors to sell the YTD market rally since January and even as the market soared to new highs. If you had listened to Wilson since January, you might have missed out on the epic market rally to new highs. His tune hasn’t changed and his rhetoric and analysis has only emboldened his calls. Now nicknamed “Worried Wilson” on Finance Twitter #fintwit, his latest notes are revealed to be more worrisome for market participants.
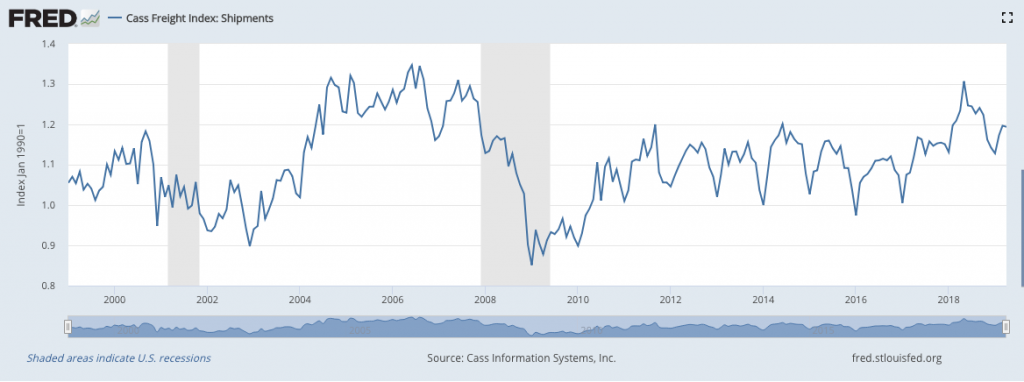
“The macro and micro economic data continue to deteriorate with weak durable goods orders, disappointing capital spending, soggy retail earnings, lackluster freight shipments, and a “very soft” jobs number as evidence of an economy running on fumes.
Wilson uses the Cass Freight Shipping Index to validate his freight shipment concerns for global trade volumes. In earnest it did moderate lower as of the latest data, but it is still running at trend growth, as shown in the index chart above. In fact, the main reason for the deceleration from the 2018 peak is exactly what caused that acceleration in mid-2018, front loading and shipping of goods leading up to the China/U.S. trade tariffs applied.
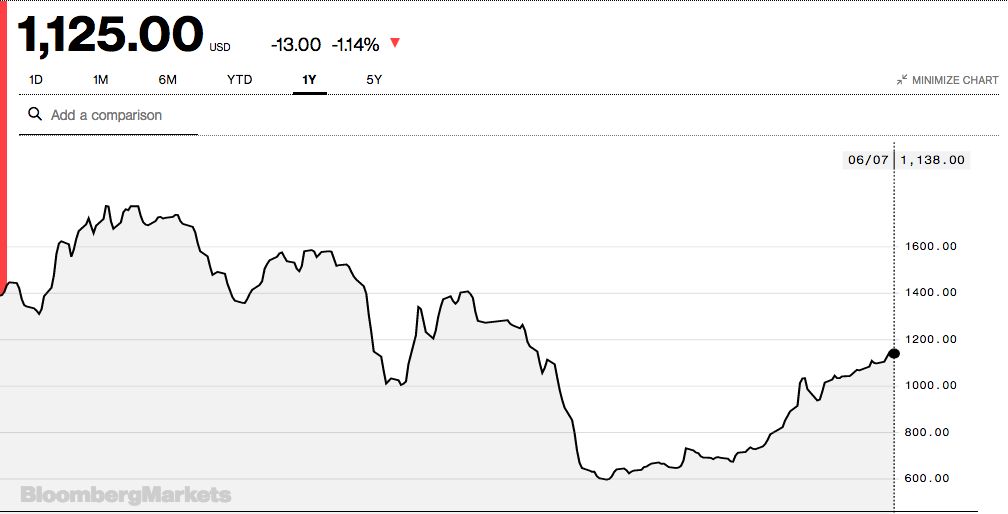
Of course, that definition was not found in Wilson’s notes. What else you won't’ find in Wilson’s notes is trucking tonnage data that remains at cyclical highs and the continued, 2019 rebound in the Baltics Dry Index as depicted below:
Wilson goes on to say, “This raises the risk of my core view playing out — that companies will do whatever it takes to protect margins. And while labor is the last lever they pull, they will use it if they need to.”
We numerate Wilson’s main points as follows:
- The Fed likely can't fix what ails the economy at this point in the cycle.
- Many data points the past month supporting his view for an earnings recession and economic slowdown, he highlights that none were as convincing as the Cass Freight Index report for April.
- The majority of multiline retailers saw negative year over year earnings growth. The stocks have been even worse with the S&P Retail Select Industry Index trading close to December's lows and its relative performance completely breaking down. This classic early cycle group may be speaking loudly about the outlook for the U.S. consumer and economy.
- Strong technicals have played a larger role than normal in this year's rally, keeping many investors more bullish than they would have been based on just the fundamentals.
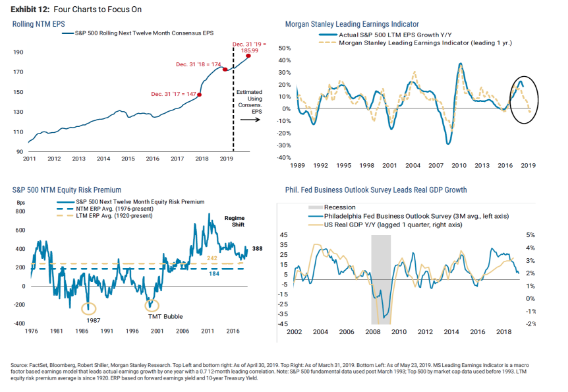
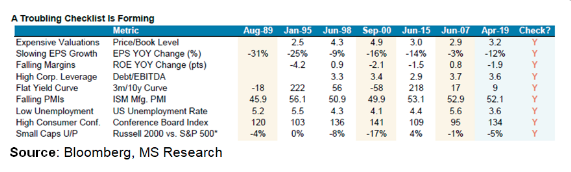
Investors shouldn’t discount all that Wilson has to offer in the way of concerns that may come to fruition. Nonetheless, price matters and to-date Wilson’s bearish profit returns for the S&P 500 haven’t materialized. It doesn’t mean they won’t in the future. In addition to the aforementioned notes from Wilson, he urges investors to consider the following 4 charts and bullet point checklist:
Back to that carrot that we placed in the beginning of today’s Daily Market Dispatch, the VIX. Recall last Friday that the S&P 500 was higher by greater than 1% and yet the VIX finished the day in positive territory. This occurred despite the weekend effect that typically sees the gauge move lower on Fridays, and the passage of a market-moving event, which proved to be the May Nonfarm payrolls report that ushered in a greater probability for a Fed rate cut. But in terms of what we typically see out of the VIX on a Friday… why is the VIX typically lower, nearly 65% of the time on Friday and absent a potential market threat looming? But to better understand the VIX calendar affect…
A trader on Friday afternoon does not want to pay full fare for an option knowing he/she faces 3 days of price decay before the market re-opens on Monday. So he/she lowers the bids a smidge. The VIX estimates the volatility of a hypothetical S&P 500 (SPX) option with 30 days until expiration, but a trader in the real world would view that option as if it only had 27 or 28 days remaining. That has the effect of lowering the bid on Friday, in volatility terms. This coupled with weekly hedges being removed tends to express a lower VIX on Fridays.
Now, when we come back on Monday, voila, it’s 3 days later on the actual calendar, but maybe 0-1 day later as far as the options trader is concerned. He/she has already priced in the weekend decay on Friday, so the SPX option itself might not be much lower in actual dollars. But it’s higher in volatility terms and, thus, translates to a higher VIX on Monday. And on Monday, we typically see the VIX higher in the early hours as the VIX is “resetting”.
With those nuances out of the way and how we should typically understand the VIX calendar affect, last Friday this is not what we saw. What we saw was a VIX that was resistant to the S&P 500 usual, inverse relationship/correlation.
This was largely due to the looming threat of the U.S. placing tariffs on Mexico in the event a “trade/border security” deal could not be reached. The looming threat that would serve to greatly disrupt trade between the two nations and their respective economies was enough to force outsized hedging activity on the part of investors, adversely affecting the typical Friday VIX move lower and inverse relationship with the S&P 500 that was rising significantly. In other words, most investors held fast to the opinion that a deal would be reached, but just in case… they hedged.
This marked just the 11th time since 2004 that the VIX advanced while the stock benchmark rose at least 1%, according to Macro Risk Advisors derivatives strategist Vinay Viswanathan.
“The options market is unwilling to lower its pricing of risk further despite impressive market strength,’’ he wrote. “The stocks up/vol up move could be a sign from the option market that while equities were performing well, there is still plenty of risk worth protecting against (especially with China trade talks/G-20 lingering on the horizon).
“Pravit Chintawongvanich, Wells Fargo’s equity derivatives strategist, said in a note that the fierceness of market rallies is contributing to firmness in the volatility index. For the most part, U.S. stocks have taken the staircase down from a record close on April 30, and rebounded via the elevator.”
With respect to the infrequency of the occurrence under scrutiny, VIX and S&P 500 up together, we can review the following table offered by Troy Bombardia. In the table, the study reviews the historic occurrences for which the S&P 500 rose more than 1% on the day, while the VIX was above 15 and also rose on the same trading day.
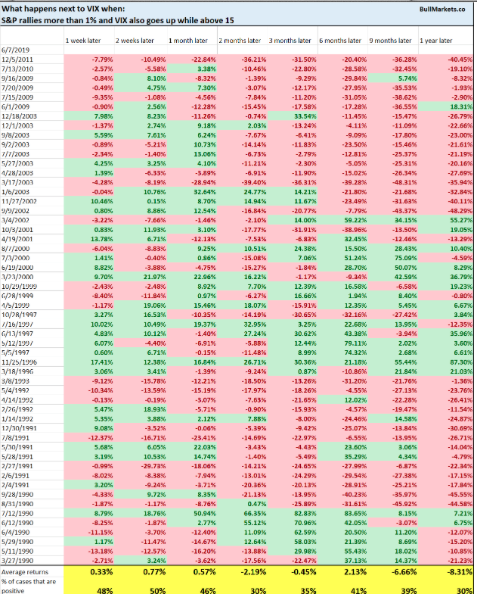
As we can see, this has occurred nearly 60 times since the VIX came into existence in the 1990s. The last time it took place in 2011, the VIX was lower across all time frames going out 12 months. The average results for the VIX among the historic occurrences are more bearish for the VIX than bullish. But that is the nature of the market, which demands complacency for equity market participation. Nobody invests in a perpetually volatile market.
With all that being said and evidenced, the VIX took back all of its Friday’s gains and finished lower on Monday, even with the S&P 500 cutting its gains in half and the VIX calendar that usually produces a higher VIX on Monday, at least in the early hours. With all this VIX chatter and worrisome commentary from Mike Wilson, Finom Group (for whom I am employed) continues to trade the Volatility complex as depicted in the following, issued trade alert on Monday.
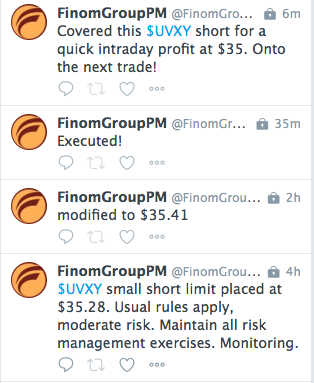
Happy trading folks!


