
Is The S&P 500 Repeating Its 2011 Correction?
Our model states that the S&P 500 is not in a bear market. (We define bear markets as declines that exceed 33.33% and last more than 1 year.) The U.S. stock market is not in a bubble, so a bear market that's caused by overvaluation is not in the cards. In addition, there is no fundamental problem with the U.S. economy like there was in 2007/2008, so an economic crisis will not cause a bear market either.
However, our model also states that the S&P is in the midst of a significant correction. We define "significant correction" as either a long correction or a big one.
The more we look at this significant correction, the more it resembles the correction of 2011. Although the fundamental reasons for these two corrections are different, the price action is practically identical. Thus, this analogue points to a potential lower low for the S&P in the upcoming months.
Different Fundamental Reasons
The 2011 correction was caused by deteriorating U.S. economic data. At the time, many investors and economists feared that the U.S. economy would enter into a recession (double dip recession). Even Warren Buffett went on record saying that the U.S. economy had suddenly deteriorated. Coming from the King of Bullishness, this was a frank and honest testament to the weak state of the U.S. economy.
The factors that are driving the current correction are a little different. No, this correction is not being caused by the Chinese stock market decline. China was in a bear market from 2010 to 2013, yet the U.S. stock market experienced a massive rally. According to our model, the current correction is caused by a medium term overvaluation problem.
After a massive rally in 2013 and 2014, a significant correction is to be expected.
Same Price Action
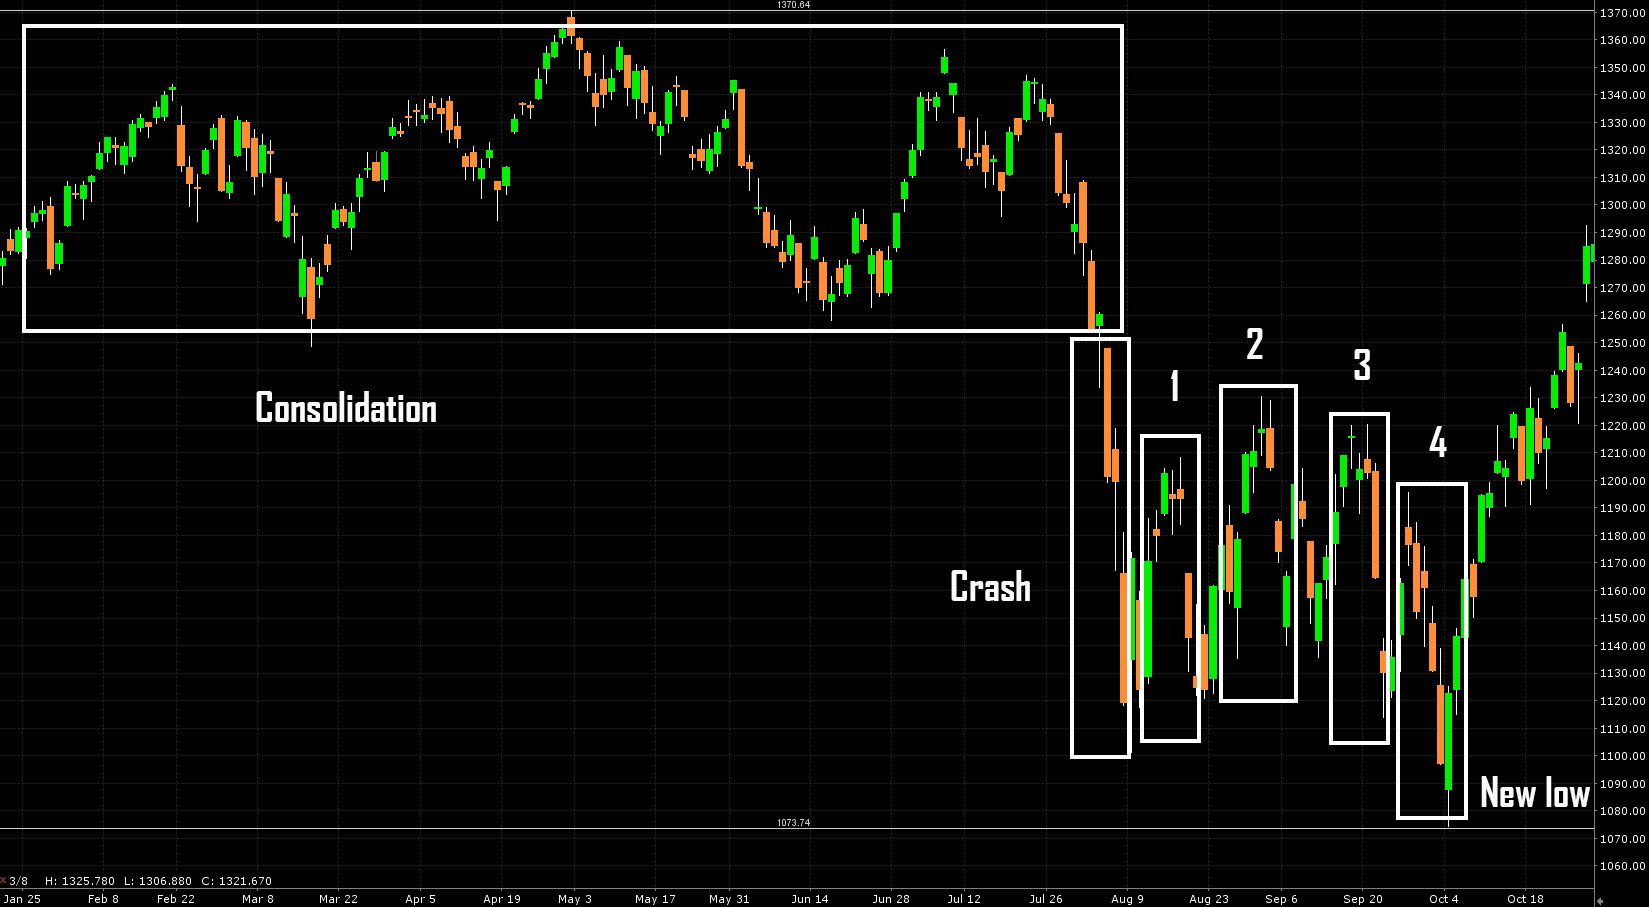
Despite their differences, these two corrections have eerily similar price action. Let's look at the different stages of the 2011 correction.
- The S&P 500 consolidated for many months from the beginning of 2011 to mid-2011.
- The S&P 500 then crashed in August.
- The S&P 500 bounced and made 4 individual waves from August to September.
- The S&P 500 made a final low in early October.
What's eerie isn't just the price action: the timing of each stage is very similar to right now.
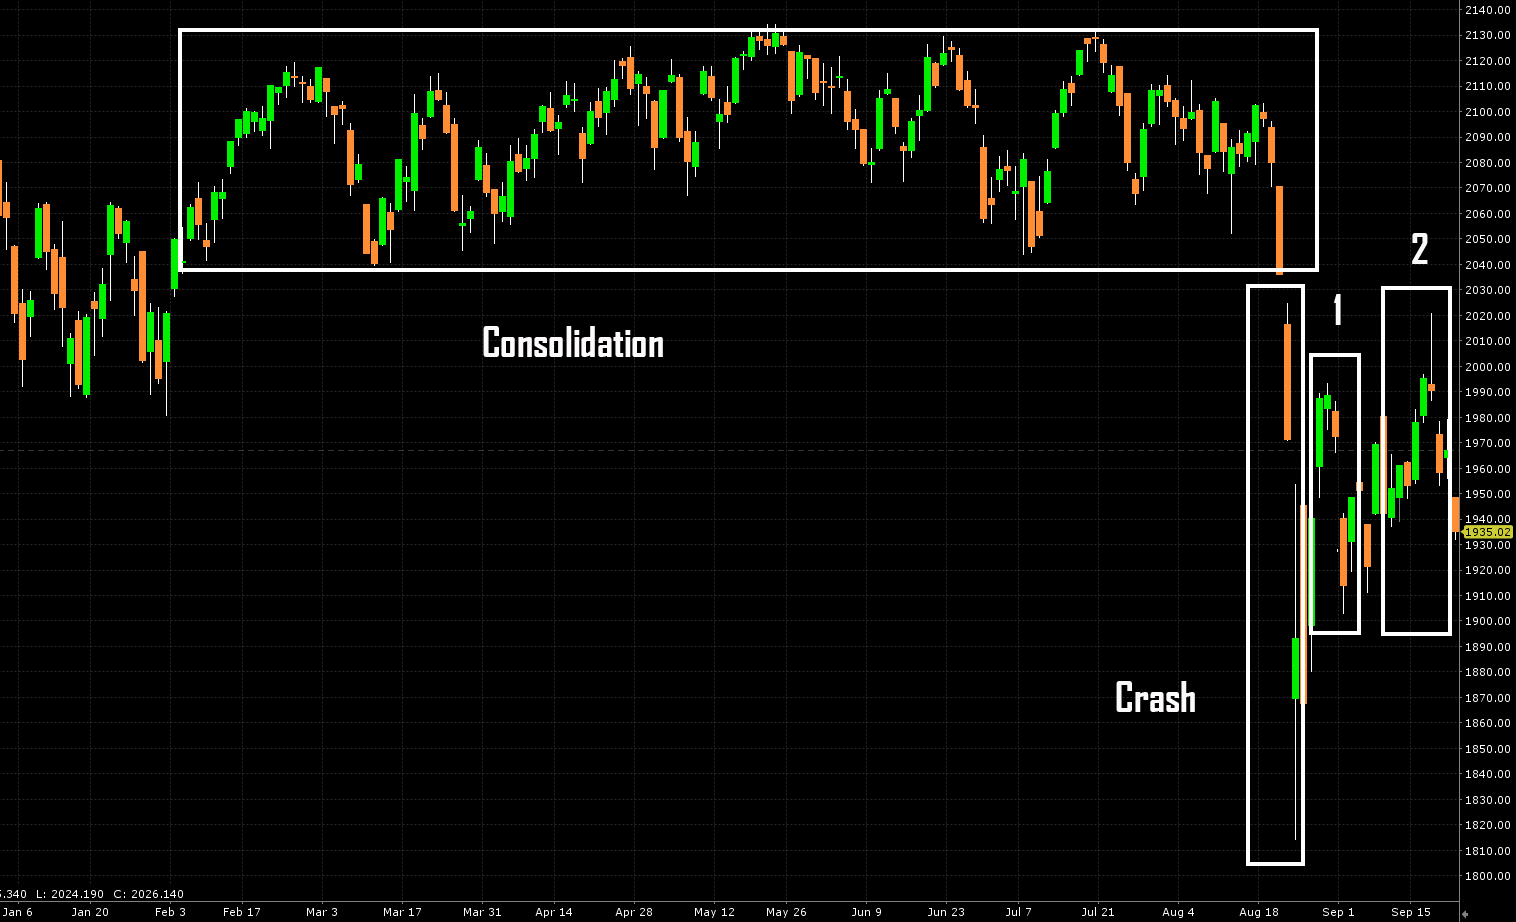
- The S&P 500 consolidated for many months from the beginning of 2015 to mid-2015. (This was, by some accounts, the tightest consolidation on record. Volatility was virtually nonexistent).
- The S&P 500 crashed in late August (the few days around August 24).
- The S&P 500 is bouncing right now...
What's even more interesting is that even the 4 waves of the August-September bounce are starting to look alike.
- In both of these 2 corrections there have been 2 waves with higher highs.
- The 2nd and highest wave is stopped at the 50ema. The S&P was just stopped at the 50ema last Wednesday).
Below is the chart for 2011's correction. As you can see, it's the 4th wave that causes the S&P 500 to make a post-crash low.
Click on picture to enlarge
Below is the chart for the current correction.
Click on picture to enlarge
Is the S&P about to complete Waves 3, 4, and then a new low? Perhaps. There's another reason why stocks bottomed in early October 2011, and why stocks might bottom in early October 2015 as well.
Earnings season is typically very bullish for stocks. Since 2000, the median gain for an earnings season month (January, April, July, October) is 60% more than the median gain for a typical non-earnings season month. So if the S&P 500 makes a new low in the next few weeks, there's a strong chance the Q3 2015 earnings season will end this big correction.
Disclosure: We are currently sitting on 100% cash. We're waiting to buy stocks.


