
Is The Market Slowly Rolling Over? S&P 500 Puts Galore
For 3 straight trading sessions, the major averages have sold lower into the closing bell. This is in contrast to the 9-week rally prior to the final week of February. One thing to keep in mind with respect to the 9-week rally and even the December 2018 market swoon is the concept of market liquidity, as it pertains to volume. Just as the market expressed a lack of liquidity in December and as redemptions were expedited, volume has continued to decline. Having said that, the declining volumes have reversed where the pain is being felt in 2019, from the short side of the market. That can all change in a heartbeat.
What we are better able to understand about the 9-week rally is that it has been led, primarily by a handful of stocks. This was previously outlined in Finom Group’s (for whom I am employed) weekly research report titled The Market is Safe, So Long As You Identify Its Pain Points
“The fact is that there might be a group of firms out there in the fund “managementshpere” that are simply so large they understand that if they target one of the most heavily price-weighted stocks in the market, they can essentially move the entire market. That means they cannot only move the Dow, but the S&P 500 and Nasdaq (NDX). If you can drive order flow into the 5 top weighted names in the Dow index you can essentially dictate order flow throughout the markets.”
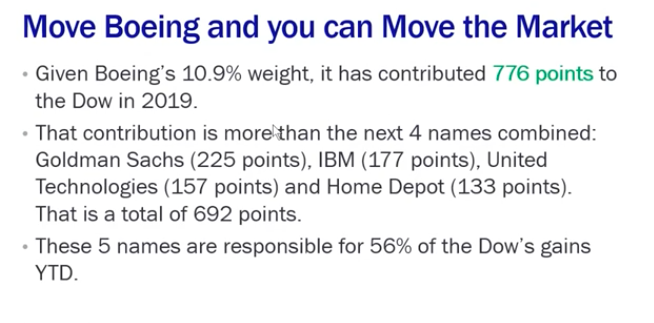
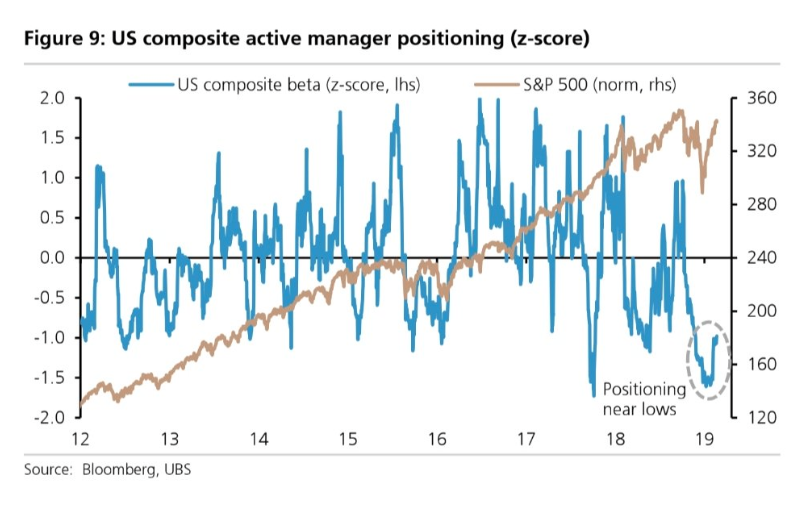
As discussed in the Research Report, firms are pretty much arbitraging the market by targeting these stocks with Boeing (BA) being the main driver. Beyond that point of articulation and with the knowledge that BA shares are up some 32% in 2019, we also recognize that fund managers really haven’t participated in the 2019 market rally. The following chart, offered by UBS Financial identifies the S&P 500 rally in the face of extremely low active fund manager positioning.
The 9-week long rally has expressed a healthy breadth thrust and found with overbought conditions coming into the trading week, but volume continues to dwindle. Volume is important. Volume shapes support and resistance; it tells you where somebody bought and where somebody sold at a certain price. While market momentum and overbought conditions can persist, they often do so up to a point of rejection, and that is defined by VOLUME. We may have experienced that point of rejection, as the S&P 500 surged above 2,800 and has since fallen back below 2,795.
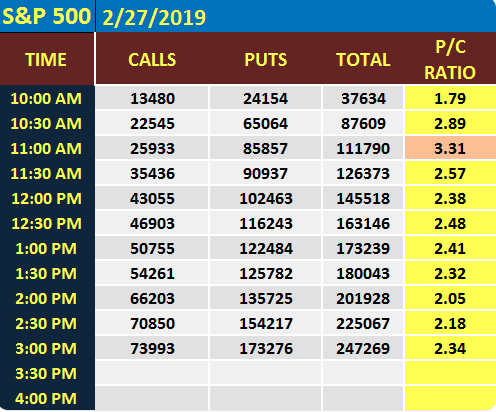
We’ve already witnessed strong VIX call option buying this week that identifies how uneasy market participants may be after a near 19% S&P 500 rally off of the December 24, 2018 lows. And in Wednesday’s trading session there was stealthy Put buying in the SPX options markets.
The stock market’s strong rally has been accompanied by falling volume. We have supporting charts that identify this point of articulation beyond contestation. Technical analysis suggests that “rallies accompanied by falling volume” are bearish to one degree or another. So let’s now take all this dialogue and try to deduce the possible outcomes near term when S&P 500 rises over 10% in 10 weeks, but volume drops by 50% or greater.
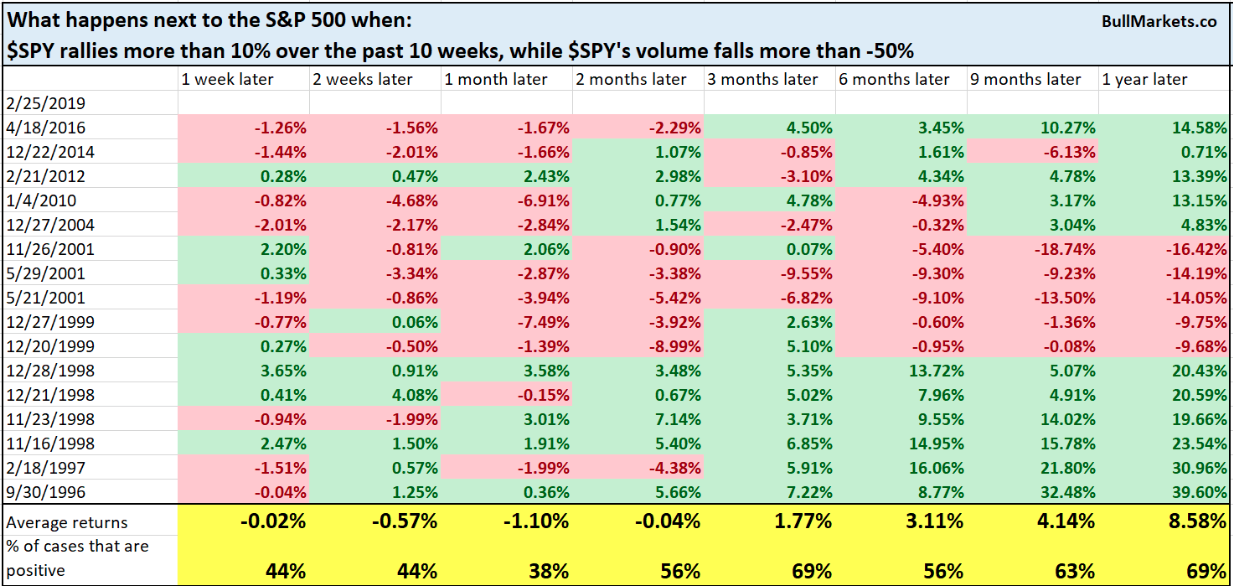
So while I’ve offered a lot of evidence that suggests the market should succumb to more selling pressure near-term, historically and statistically speaking, the table from Bullmarkets.co suggests the pullback would be harmless. Having said that, “this aint your grandpas S&P 500” anymore and when programmed trading kicks in…
With respect to the macroeconomic picture, the data continues to roll out and prove a mixed bag of data. While some areas of the economy are still on solid footing other areas are less robust and signaling an economic slowdown that may have exacerbated in the December 2018 period. According to Reuters, data from the Commerce Department on Wednesday showed new orders for U.S.-made goods barely rose in December and business spending on equipment was much weaker than previously thought, pointing to a softening in manufacturing activity.
The Commerce Department said factory goods orders edged up 0.1% in December amid declining demand for machinery and electrical equipment, appliances, and components. Data for November was revised slightly up to show factory orders falling 0.5% instead of the previously reported 0.6% drop. Economists polled by Reuters had forecast factory orders rising 0.5% in December.
Orders for the so-called core capital goods declined 1.1% in November. Shipments of core capital goods, which are used to calculate business equipment spending in the gross domestic product report, were unchanged in December instead of the previously reported 0.5% increase.
On a brighter note, pending home sales jumped 4.6% in January, the National Association of Realtors said Wednesday. Sales were 2.3% lower than a year ago, making January the 13th straight month of year-over-year declines.
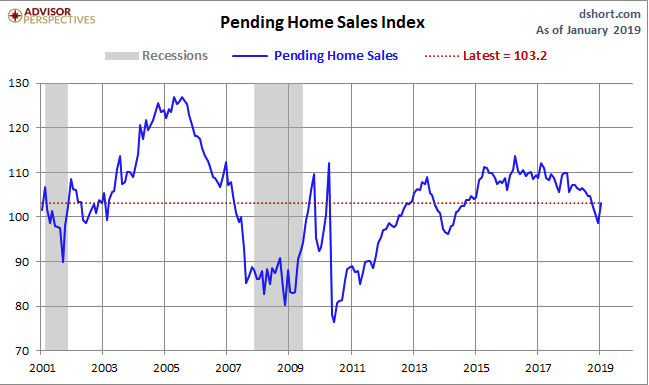
“We have argued recently that existing home sales would soon have to hit bottom, and this report tentatively suggests that the worst now is over; the 50 [basis points] drop in mortgage rates since late last summer is helping,” said Ian Shepherdson, chief economist for Pantheon Macro.
“February existing home sales should now rebound handily and with new home sales likely to head higher too, given the rising trend in mortgage demand, the gloomy housing narrative in markets and the media is set to change quite dramatically over the next few months. The market is not rolling over, and it is not a harbinger of recession in the broader economy.”
In putting some of the more recent economic data reports together, investors will get to witness firsthand just how strong or weak the economy was in Q4 2018. The GDP report will be out ahead of the opening bell and met with much scrutiny since the report had been delayed due to the prolonged government shutdown. With the latest economic data in mind, economist polled by MarketWatch forecast GDP to come in at 1.9% and slightly higher than the most recently revised Atlanta Fed GDPNow forecast of 1.8 percent.
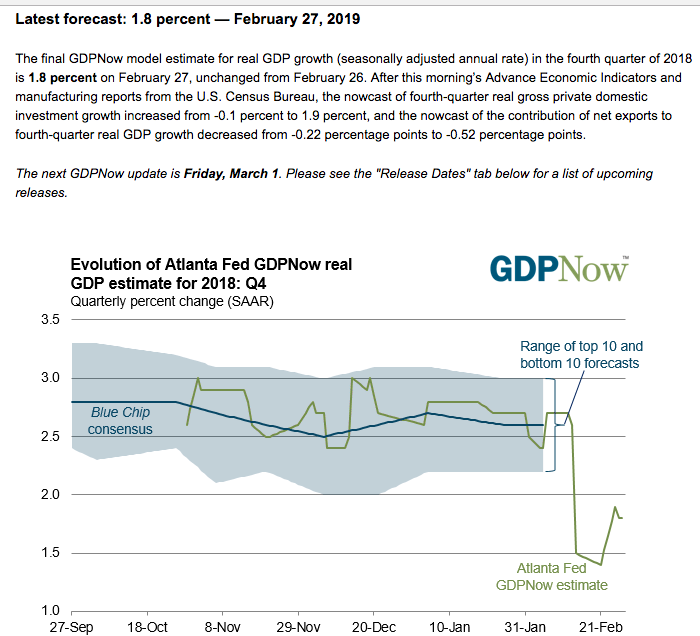
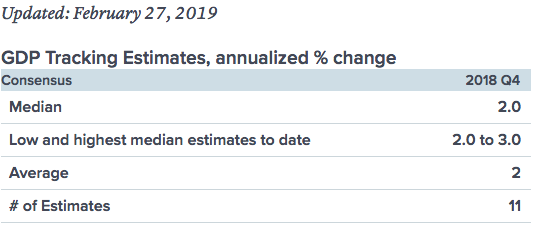
In addition to the Atlanta Fed and MarketWatch forecasts, CNBC’s Rapid Update on GDP shows a median forecast for Q4 2018 GDP of 2 percent.
Since Q4 2018, the macroeconomic dialogue and forecasts for the global economy has been one of a synchronized slowdown. But some economists are of the opinion that the global slowdown has actually bottomed out already. Goldman Sachs Group Inc. Chief Economist Jan Hatzius. Says that while growth remains soft, Goldman’s current activity indicator in February is slightly above the downwardly revised December and January numbers.
“Some green shoots are emerging that suggest that sequential growth will pick up from here,” Hatzius and Sven Jari Stehn wrote in a note dated Feb. 26. Still, the risk to Goldman’s global GDP forecast of 3.5 percent for 2019 “is probably still on the downside.”
Goldman’s notes on the markets are offered as follows:
- Remains positive on risk assets, although upside is now probably lower as markets have become “more sanguine on recession” expects bond yields to rise maintains a bearish dollar view, given a dovish Fed and expectation for a pickup in global growth is modestly bullish on oil over the next 2-3 months but sees a more bearish outlook for the remainder of the year. The case for a pickup from the current pace is strongest in the U.S. as the drag from a tightening of financial conditions eases.
Goldman reckons Europe looks like the weakest major region, “with Italy in recession, Germany close to it, and most other economies growing at only about a trend pace,” according to the note. Goldman has pushed back its expectations for the first ECB hike from late-2019 to mid-2020. Goldman also sees tentative signs of a turnaround in Chinese growth.
While Goldman offers an optimistic outlook for China’s economy, it isn’t quite showing up in the data just yet. Factory activity in China contracted to a three-year low in February as export orders fell at the fastest pace since the global financial crisis
The official Purchasing Managers’ Index (PMI) fell for the third straight month, dropping to 49.2 in February from 49.5 in January, according to data released by the National Bureau of Statistics (NBS) on Thursday. The 50-mark separates growth from contraction on a monthly basis. Analysts surveyed by Reuters had forecast the gauge would stay unchanged from January’s 49.5.
Despite the slowdown in manufacturing, total new orders, an indicator of future activity, edged back into expansionary territory, suggesting some improvement in domestic demand. The sub-index rose to 50.6 from 49.6 in January, after falling for two consecutive months. However, China watchers typically advise caution over interpreting the country’s economic data early in the year because of the timing of the weeklong Lunar New Year holidays.
“Unless the trade war truly turns into an extended truce, the weakening trend may not end quickly,” Iris Pang, Greater China economist at ING, said in a note. “As such we expect March’s PMI to fall, too.”
It’s clear that the U.S./China trade feud has had negative ramifications on the global economy and it is especially felt and expressed in the weakening Chinese economic data. Further tariff escalations have been halted in favor of allocating more time to construct a deal that finds favor for both parties engaged in the yearlong dispute. With this in mind, J. P. Morgan Chase offers their best and worst case scenario regarding U.S./China trade talks and activity:
US/China scenario analysis
- Best case (15% odds) – the US and China formally unveil a full and final trade agreement by the end of Apr with credible monitoring and enforcement mechanisms along w/large purchase commitments from Beijing (~$1T over 5-6 years) and expanded market access for American companies. Not only is the threat of incremental tariffs removed but existing ones are fully rescinded immediately.
- Good case (31% odds) – the same as “best case” but while incremental tariffs are taken off the table, Trump only rescinds the most recent tranche (10% on $200B) and keeps the original tranche (25% on $50B) in place pending Chinese compliance with the deal.
- Base case (29% odds) – the same as “best case” but all existing tariffs stay in place (10% on $200B and 25% on $50B) w/the US promising to remove them gradually over the course of ~6 months pending Chinese compliance with the deal.
- Subpar case (10%) – the two sides extend the Mar 1 deadline for an additional 6 months and leave all existing tariffs in place while additional talks occur.
- Bad case (10% odds) – the US and China prove incapable of reaching a trade agreement by the end of Apr and Trump moves forward with tariffs on the incremental ~$250B worth of Chinese imports but at the 10% rate (instead of 25%) or he raises the current 10% rate to 25% (but only on the existing $200B worth of imports, not the incremental $250B).
- Worst case (5% odds) – the US/China negotiations collapse in acrimony and Trump moves forward with tariffs on all Chinese imports (i.e. the second $250B tranche) at the full 25% rate (vs. 10%/$200B and 25%/$50B).
At the risk of becoming long-winded, I urge investors and traders to weigh their risk at present market levels. We’ve come a long ways off the bottom and without certainty on earnings growth, this early in the fiscal year; the market may need a breather. This may be the time to construct your list of stocks to buy should valuations pull back to one degree or another.
There still remain certain factors that demand a resolution for improved global growth. A U.S./China trade resolution would go a long ways toward improving global economic sentiment and possibly lend itself to realize an uptick in global economic activity. And we shouldn’t forget the ongoing Brexit saga remains lingering. If those issues weren’t enough to cause for concern, there’s probably a more domestic political reason investors are buying S&P 500 put options of late, the debt ceiling.
The U.S. will need to raise the debt ceiling sometime after the current suspension expires in March, and the ongoing conflict in the nation’s capital raises the possibility that the process may not go smoothly. Failure to raise the debt ceiling in a timely and orderly fashion could have lasting negative effects, including a loss of market confidence in U.S. debt. Democrats, who hold the majority in Congress, are already looking at the Gephardt Rule.
Equity futures are slightly lower across the board in the 7:00 a.m. EST hour and after modest declines in the Asian markets overnight. European markets are also expressing modest losses ahead of key U.S. economic data.
And with all that, I’ll leave you with Finom Group's daily, Technical Market Recap from Wayne Nelson.


