
Is The Market Catching Its Breadth?
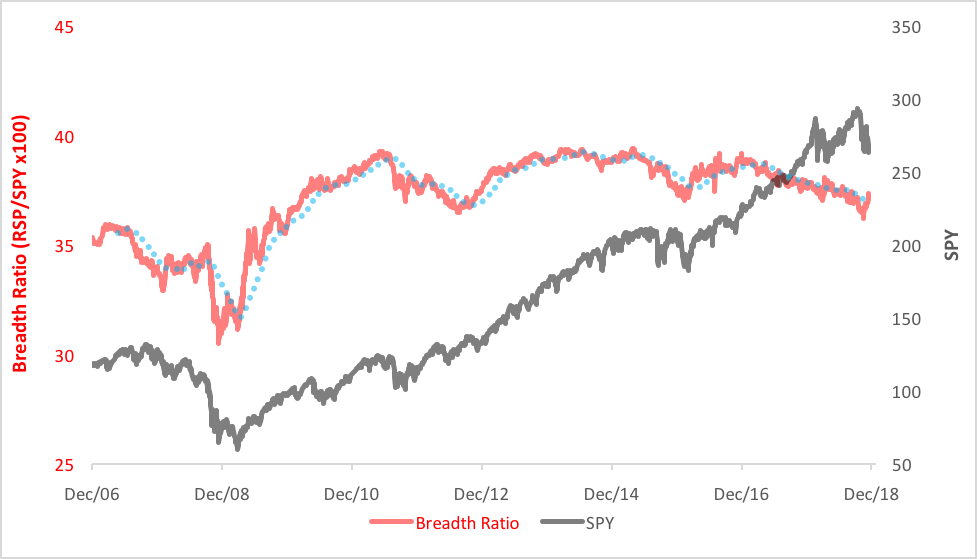
Concentration is the bugaboo of capitalization-weighted indices. We’ve seen this risk made manifest in the SPDR S&P 500 ETF (NYSE Arca: SPY) over the past year. Cast your peepers on the chart below. The red line depicts the course of the S&P 500 Breadth Ratio, the black traces SPY’s daily closing price. Notice how the red line turned down in 2017 as SPY was rising to new highs?
As of this September, Apple Inc. (Nasdaq: AAPL), the largest component of the S&P, took up 4.21 percent of the index’s weight. Just three months before, AAPL’s index weight was 3.95 percent. The year before that, the technology giant’s heft was just 3.62 percent. This pattern was repeated throughout the information technology sector. Last year, the tech stock slice was a little more than 22 percent of the S&P’s capitalization. At last look, it had grown to nearly 26 percent, a substantial portion by any measure.
See the problem? With a market-cap-weighted index, the winners just keep getting bigger and bigger. Until they don’t. The fate of SPY and the other exchange-traded products that track the nominal S&P 500 have been held hostage by iPhones and search engines. No wonder the S&P stumbled so badly when tech started to wobble.
Not all S&P 500 trackers succumb to concentration risk, however. The Invesco S&P 500 Equal Weight (NYSE Arca: RSP), for example, gives each index component equal weight in the portfolio, magnifying the impact of smaller stocks. At each quarterly rebalancing, the winners are pared back in favor of the losers. Sound like a recipe for investing success?
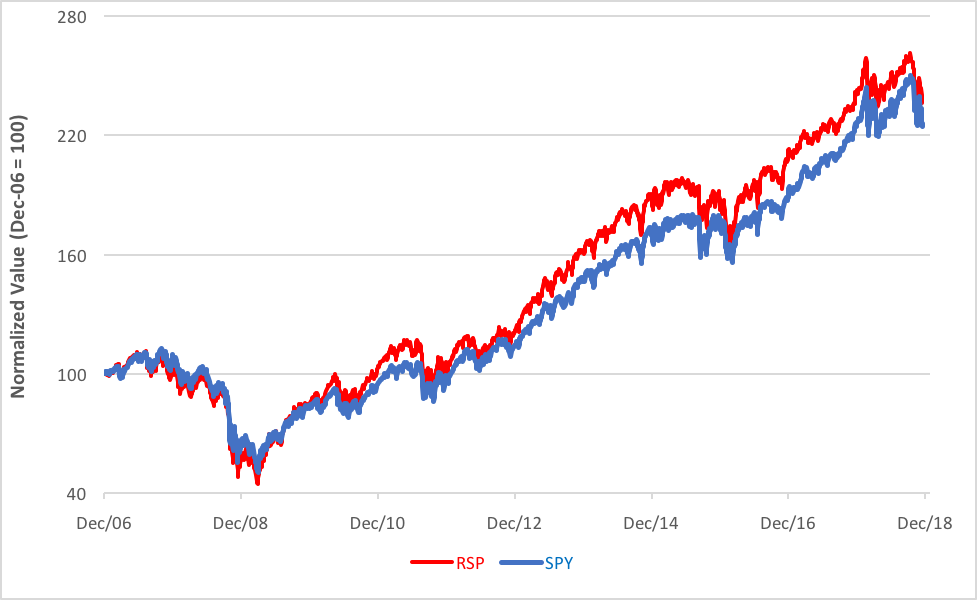
In the long term, it is. RSP’s equal-weight strategy has paid off in better cumulative returns compared to the market-cap SPY. As you can see in the chart below, RSP’s ahead of SPY by 12.50 percentage points since December 2006.
RSP is a bellwether of market breadth. It’s the numerator in the breadth ratio featured in our first chart. SPY is the denominator. Just last week the ratio crossed above its 100-day moving average (pictured by the blue dots) for the first in months. Does this mean concentration risk has dissipated? It’s too early to tell. A meteoric lift-off à la 2009 this ain’t. At present, it’s simply a reflection of the tech sector’s diminution in an aging bull market. But it bears watching. Technically, the ratio’s now bouncing off its former downside objective near 36.91. As long as that level holds, breadth is in an upturn.
Or, more properly, concentration is on a downswing.
Disclosure: None.


