
Is It Over? And What To Expect Next
I ended last week's pre-holiday missive with the following:
"It is easy to say the bulls are due. Really due".
And as if right on cue, stocks proceeded to bounce hard the following session with the Dow Jones Industrial Average enjoying its biggest one-day point gain in history: 1,086.25. Nice.
To be sure, the bounce was to be expected. The market was oversold - as in VERY oversold on - just about every metric. The sentiment was reaching "give up" levels. Technical support zones had been obliterated. Trend measures pointed straight down. Market models flashed sell signals across the board. Everybody was now a bear. And the VIX had finally exceeded the magical 30-mark. As such, once the White House assured everyone that Jay Powell's job was "safe," (and for the record, the Fed Chair can only be fired for "cause" - aka malfeasance) an explosive, sigh-of-relief / short-covering / it's-time-to-go-the-other-way rally began. It will suffice to say that Wednesday was a good day.
But then came the reversal early Thursday morning. In keeping with the current trend, traders wasted little time returning to the sell button. If you will recall, prior to the big bounce, the game had been to sell into EVERY advance the indices offered - no matter how short or small. So, with the market sinking again, the goodness of Wednesday's algo-induced blast appeared to be at risk.
Well, until 2:30 pm eastern time, that is. At that point, the boys trained their computer toys on the buy side. Word was that some $60 billion in pension money needed to be invested. So, in the ensuing 90 minutes, the Dow surged 860 points. Yowza! Talk about a perfect example of computers chasing their tails.
It was at this point that the, "Is it over?" calls began. Two straight up days. A key reversal. Losses quickly being erased. Suddenly everybody was feeling better about the market. Suddenly it was time to "take advantage" and to "buy the dip," right? Or so I was asked.
My response to the inquiry of whether or not this was time to abandon our risk-managed positions and reinvest the cash on the sidelines was simple, "Not so fast!"
The Crash Playbook Back In Play
I explained that the current decline represents a classic "waterfall decline" or something William O'Neil termed a "bad news panic." I opined that since the environment was now identifiable, every trader on the planet was about to implement what I call the "Crash Playbook".
I have reviewed the playbook many times over the years and my guess is that most readers have their own versions by now. So, let's turn to chapter 3, "The Dead Cat Bounce."
The playbook reminds us that after an initial painful decline and the emotional low, a bounce of the dead cat variety begins. The surge higher is usually short, sharp, and takes your breath away. I think we can make a check mark here.
The only question at this stage of the game is how high will the bounce go? The level getting the most attention on the topic is around 2600 on the S&P 500 and 24,400 on the DJIA. And should the S&P manage to get through the 2627 level and hold on, technicians can argue that the low of this bear phase had been seen.
What Comes Next?
Let's return to the playbook. History teaches us that after some exciting upside action during these short/sharp bounces, the reason the decline began in the first place tends to resurface. The indices bump into resistance as the initial dip-buyers are back to even, fear returns, and all the traders and their machines go the other way. Thus, the "retest" phase begins.
After all the V-Bottoms that have occurred over the past seven years or so, the question I was asked late last week was, "Dave, should we really expect stocks to go back down? Do we really need a retest?" The answer, in a word, is, yes.
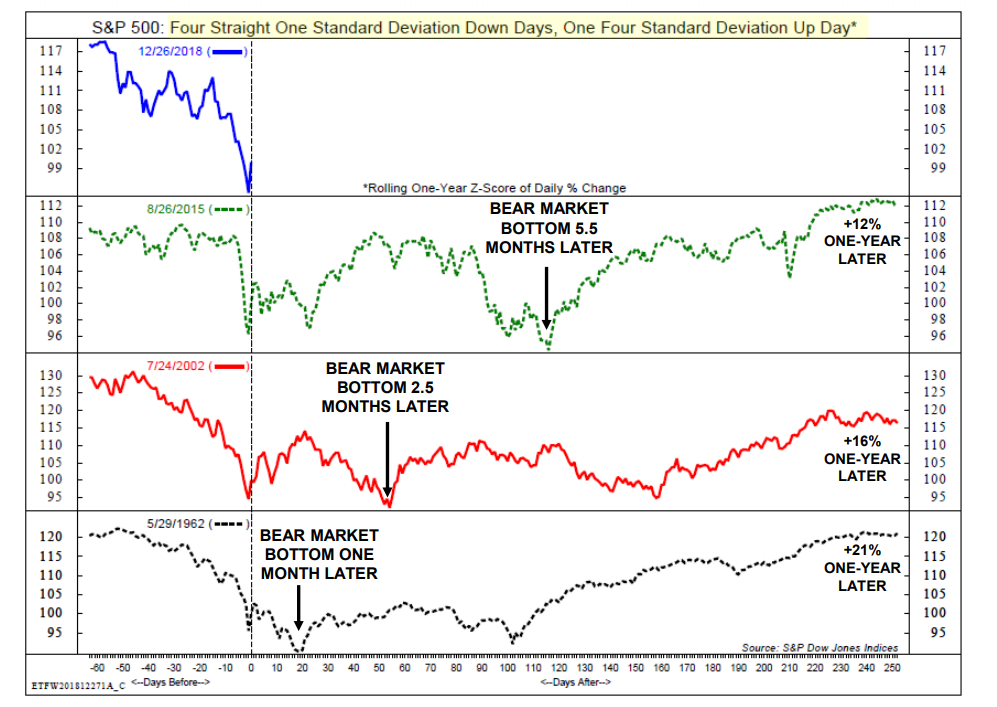
Exhibit A in my argument comes from the good folks at Ned Davis Research. NDR looked back at history and suggests that the markets that most closely resemble the current action were the bears of 1962, 2002, and 2015.
These markets were chosen for many reasons. One of the important criteria was the violent price action into and then out of a bottom. Mathematically speaking, NDR looked for markets where there were four straight one-standard deviation down days followed by a four-standard deviation up day. In other words, they were looking for what we have seen recently - a prolonged flush to the downside followed by an explosion to the upside.
Below is a chart comparing the current market with the bears of 2015, 2002, and 1962.
Historical Review: Expect A Retest
(Click on image to enlarge)
Source: Ned Davis Research
The key takeaway is that the first bottom, which was followed by a big bounce (a four standard deviation upside event), wasn't the ultimate bottom in these cases. No, in 2015, the ultimate bottom occurred 5.5 months later. In 2002, the low was 2.5 months after the initial bottom. And in 1962, the final bottom was put in 1 month after the first bounce began.
Next, many analysts have noted that there were several 5% up days that didn't lead to the final low in 2008 - and in the 1930s. Ugh.
For the statistically inclined, I present Exhibit B. The following chart shows what has transpired after the biggest "bounces" occurring during corrections and bear markets going back into the 1920s. The first two columns show the date and gain of the best rally day during the corrections/bears. The third column contains the drop from the top of the best rally until the ultimate correction/bear low.
Historical Review: Decline From Initial Bounces
(Click on image to enlarge)
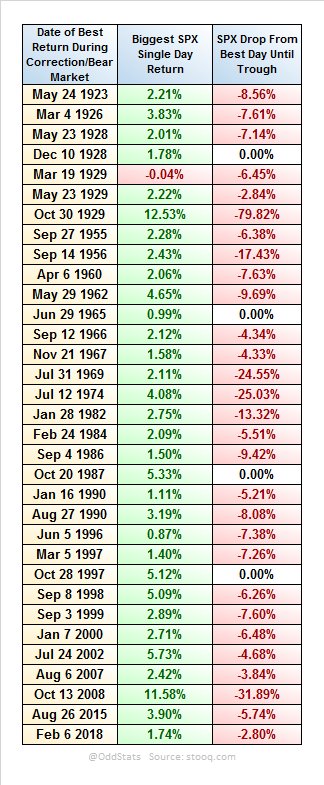
As you can see, the market usually declines a fair amount after a strong bear market bounce. In fact, the average pullback after the strongest rally of each bear market since 1923 on the S&P has been -10.22%. And if one removes the -79.8% decline seen in 1929 and the -31.9% drop in 2008, the average falls to -7.3%.
In English, this means that after the biggest rallies seen in bear markets, the indices experience a pullback the vast majority of the time. So, if one applies the average historical decline of -7.3% to Thursday's high, you get 2308, which would represent a new low level for the current bear. And yes, it is easy to argue that the current bounce isn't over. But keep that average -7.3% pullback in mind the next time this market starts to look toppy.
But, to be fair, this is not to say that a 5% up day hasn't marked the ultimate bottom during bear markets. According to Sentimentrader.com, a 5% up day did mark the lows in 1970, 1987, 1998, and 2009. So, there's that.
Are We Sure This Is A Bear?
Another good question at this stage of the game is whether or not we've actually got a bear market on our hands. For me, this is simple. If it looks like a bear (check the weekly charts), walks like a bear (review the declines of the major indices), and acts like a bear (look at the number of stocks down 20% or more and the global markets), it's probably a bear.
So, just because the S&P's decline on a closing basis has not yet breached the -20% mark does not mean that we don't have a bear market on our hands.
Next, I'll offer an updated version of NDR's chart comparing the historical action of corrections versus bears and let you decide for yourself.
Historical Review: Bear Versus Correction
(Click on image to enlarge)
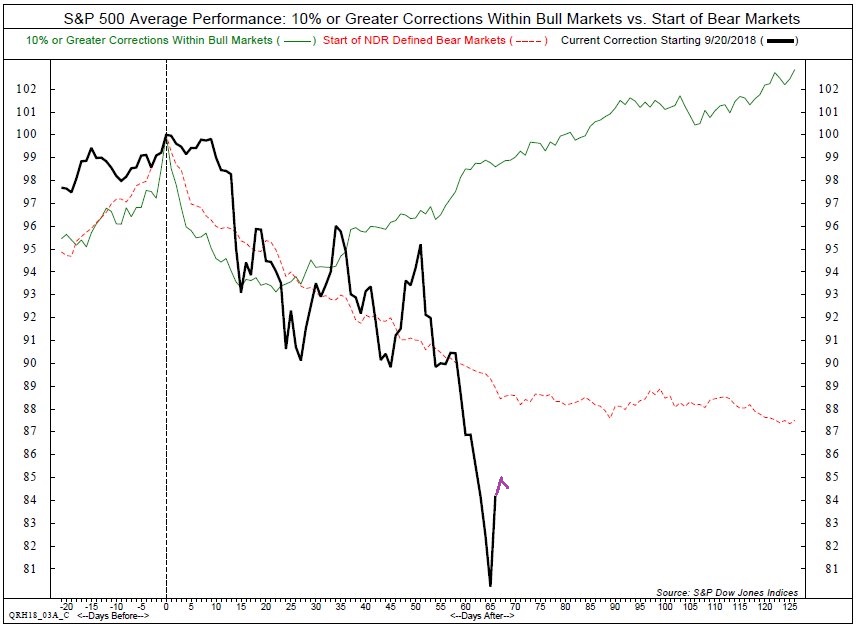
Source: Ned Davis Research
The bottom line here (for me, anyway) is if the bulls can't make a higher high and then start trending higher right here, right now, the answer is pretty obvious.
The Good News
The good news here is we need to remember that the best returns in the market occur AFTER bear market declines. If memory serves, I believe one-third of bull market gains occur in the first one-half of the bull's run.
The point is that once a bear market finally does bottom and that bottom is successfully tested, the gains tend to be pretty good.
From a shorter-term perspective, it is important to recognize that once extreme oversold and sentiment conditions are achieved, rallies tend to follow. Again, once the retest is out of the way, of course.
For example, below is a chart showing the returns of the SPY after extreme negative readings are achieved on Ned Davis Research's Short-Term Sentiment model.
Historical Review: Returns After Negative Sentiment Extremes
(Click on image to enlarge)
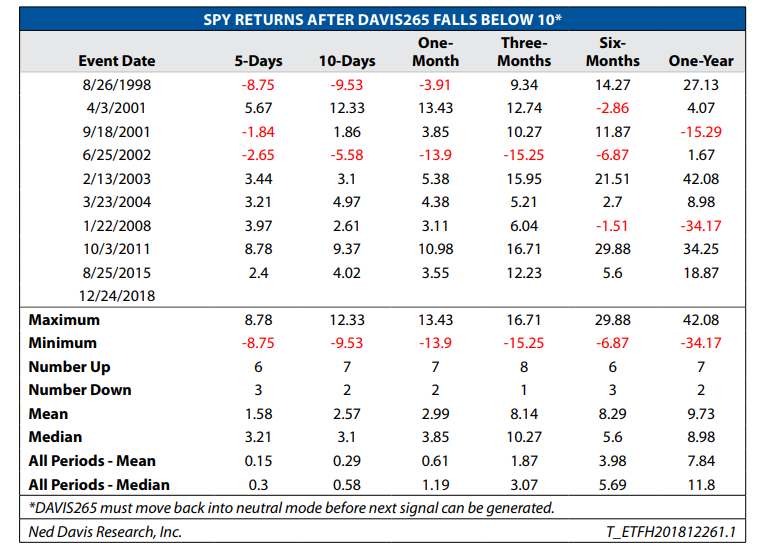
Source: Ned Davis Research
As the chart indicates, two weeks after the extreme sentiment reading was reached, the average return for the SPY has been 2.57%, which is nearly nine times the average return for all two-week periods. And since the SPY has been higher two weeks later 7 out of the 9 occurrences, the odds of a gain over the next two weeks would appear to be roughly 78%.
Three months after an extremely negative sentiment reading, the SPY was higher 8 out of 9 times, sporting an average gain of 8.14%, which is four times the norm for all three-month periods.
Next, we have research for Lowry's reviewing the S&P 500 performance after the extreme oversold conditions.
Lowry's looks at the percentage of stocks above their 10-day moving averages as a way to measure overbought/oversold conditions. The table below illustrates the results of the S&P when the percentage of stocks above their 10-day MA's was less than 10% for a minimum of three consecutive trading days.
Historical Review: Returns After Extreme Oversold Conditions From 1990
(Click on image to enlarge)

Source: Lowry's Research
What Lowry's found is that after such an extreme oversold signal was given, the average return for the next 12 months was +17.35%. This far exceeds the average return for all 12-month periods of +7.1%. Oh, and since the S&P was higher a year later 15 out of the 17 times, the odds of a gain over the next year are 88.2%. Not bad.
One caveat here is that, according to Lowry's, the best returns from this signal occurred after meaningful corrections or bear market lows while the weaker returns tended to occur when the market was in the early stages of a protracted bear market. Examples here would include 2001, 2007, and 2008, as well s the initial leg down during the "mini-bear" of 2011.
So, the key here would appear to be that if we are closer to the end than the beginning of the current bear move, the odds suggest that investors can expect strong gains in 2019. But, if we are merely in the early stages of this bear, the current oversold condition isn't likely to be the last.
The Takeaway: Caution Near-Term, Optimism Longer-Term
To sum up, my take on the current situation is as follows. First, forgive me for donning my Captain Obvious hat here, but I believe stocks are in the midst of a cyclical bear market. Given that the secular bull which began on March 9, 2009, is likely to remain intact and we do not expect a recession to accompany this move, we will be looking for a more modest bear attack and NOT something akin to 2000-02 or 2007-09. No, we're expecting something more in the -20% to -25% range.
Since several indices and many stocks have already breached this level, we can now begin to look for a bottom. The argument can be made that Wednesday's 1,086-point blast on the DJIA marked the bottom of the decline. History shows that some bear markets have indeed ended with such a move.
From a near-term perspective, stocks have experienced a classic waterfall/panic decline, are very oversold, and sentiment has reached extreme readings. Such conditions tend to create strong countertrend moves, which can present trading opportunities for the nimble.
Yet, history also shows that after a "dead cat bounce," fear returns more often than not and a retest of the lows (or a series of retests) occur. It is during the retest phase that Ms. Market tends to tip her hand and we can attempt to determine whether or not the ultimate low has been put in. The key here isn't necessarily the price level itself (so don't put all your eggs on those magical price levels bandied about on TV), but rather the momentum and "oomph" behind the retest phase.
In short, the bulls would like to see the retest(s) occur on lighter volume, lower VIX readings, and divergent model/breadth behavior. All would suggest that the lows are in. But if the growling grows louder on the decline, it pays to curb your enthusiasm for a while.
It is also important to recognize that the bottoming/basing process, from which new bull markets are ultimately born, takes time to complete as a news-driven market may require several tests of the bottom and for the news flow to improve.
On that front, given the current 90-day trade negotiation window currently in play with China, I presume it will take time to resolve this issue - or - for Ms. Market to become comfortable with the likely outcome. However, the good news is the "Fed Issue" (i.e. the idea that the sale of $50 billion per month is on autopilot) could easily be solved in the near-term simply by Powell stating that the current QT will be part of the Fed's overall monetary policy going forward.
From a longer-term view, in order to signal that the bear has run its course (remember, the average bear that occurs within the context of a secular bull lasts 283 calendar days or about 9 months - Source: Ned Davis Research) the bulls will want to see a series of breadth thrusts where prices surge, advancing issues swamp decliners, and up volume overwhelms down volume on a cumulative 10-day basis.
History shows that such "thrust" events act as an "all clear" signal where stock market returns tend to be much stronger than normal for the next year. And yes, you can count on us to let you know when any of these signals are flashed.
Summary: For now, longer-term investors should stay patient, remain cautious and await the "all clear" signals while shorter-term traders may attempt to "ride the range" during the bounce/retest phase.
Finally, I will be taking a break from the keyboard this week in order to recharge the batteries and prepare for what could be a very busy start to the new year.
Here's wishing everyone a Happy, Healthy, Safe, and Prosperous 2019!
Now let's turn to the weekly review of my favorite indicators and market models...
The State of the Big-Picture Market Models
I like to start each week with a review of the state of my favorite big-picture market models, which are designed to help me determine which team is in control of the primary trend.
(Click on image to enlarge)
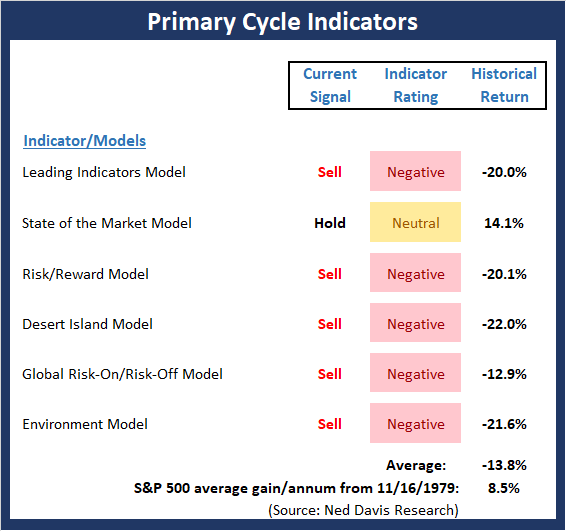
The Bottom Line:
- There was another important change to the Primary Cycle board this week as my "Desert Island" Model (if was stranded on a desert island, was forced to manage money, and could only use one indicator) fell into negative territory. I will also note the average of the historical returns for the models stands at -13.8% annualized.
To be sure, December's "waterfall decline" has pushed stocks into extreme oversold territory, which means a bounce of the "dead cat" variety was due. But, with only one of the primary cycle models not negative, the message from this board is that we've got a bear market on our hands that is likely to stick around for several months.
This week's mean percentage score of my 6 favorite models declined to 36.5 (from 41.9, 2 weeks ago: 47.8%, 3 weeks ago: 53.6%, 4 weeks ago: 57.9%) while the median fell to 440% (from 44.2%, 2 weeks ago: 45%, 3 weeks ago: 55%, 4 weeks ago: 52.5%).
The State of the Trend
Once I've reviewed the big picture, I then turn to the "state of the trend." These indicators are designed to give us a feel for the overall health of the current short- and intermediate-term trend models.
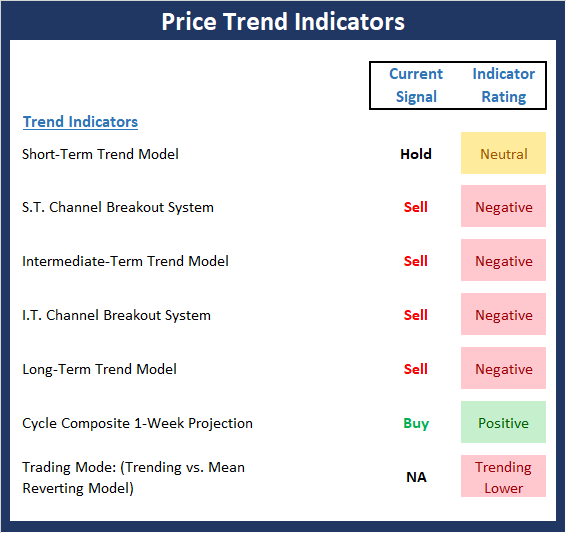
The Bottom Line:
- The recent bounce in stock prices was a welcome reprieve from the relentless selling that has taken place since December 3, which is a textbook example of a "waterfall decline" and/or "panic selling." The good news is the DJIA closed Friday 1350 points above the Christmas Eve low. The bad news is the bounce has, so far at least, not repaired any of the technical trend damage.
In order for the technical picture to improve, the major indices will need to (a) successfully test the 12/24 low and (b) create a series of higher highs and higher lows.
The State of Internal Momentum
Next up are the momentum indicators, which are designed to tell us whether there is any "oomph" behind the current trend.

The Bottom Line:
- As I wrote two weeks ago, the type of extremely negative condition seen on the Momentum board tends to lead to countertrend rallies. Thus, it was not surprising to see a near-term bounce take hold. However, thus far, there has been little in the way of improvement from a momentum perspective.
The State of the "Trade"
We also focus each week on the "early warning" board, which is designed to indicate when traders might start to "go the other way" -- for a trade.
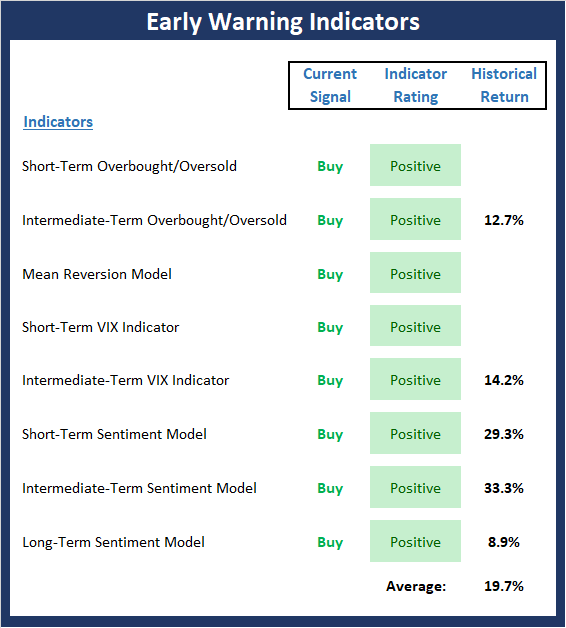
The Bottom Line:
- I wrote last week: "The table remains set for a strong countertrend rally." While the DJIA made headlines with the biggest 1-day point gain in history, the bounce so far has been a bit underwhelming. The good news is the "Early Warning Indicators" continue to sport a bright shade of green. However, traders need to be on the lookout for an "abrupt rally failure," which would likely usher in a retest and/or the beginning of the bottoming phase.
The State of the Macro Picture
Now let's move on to the market's "environmental factors" - the indicators designed to tell us the state of the big-picture market drivers including monetary conditions, the economy, inflation, and valuations.
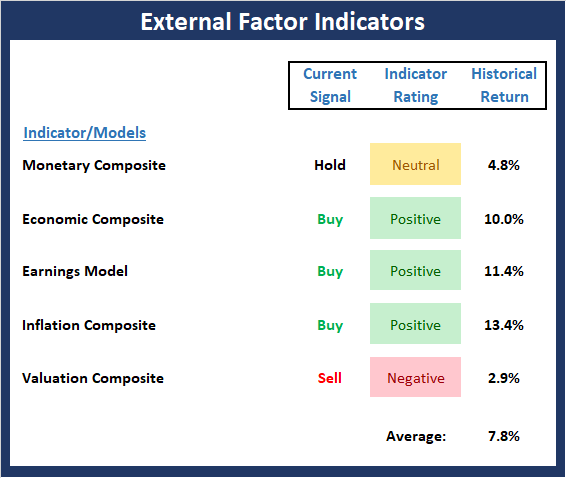
The Bottom Line:
- The External Factors board continued to improve last week, albeit at a very modest pace. The obvious change is the uptick in our Monetary Composite as rates have backed off their recent highs, have broken intermediate-term support, and are now trending lower. In addition, the Valuation Composite saw meaningful improvement in its component readings - just not enough to push the model into the neutral zone. The takeaway here is that while valuations are improving (earnings have moved higher while price has moved lower, thus improving the P/E ratio) the gains are not enough to push the overall valuation model rating higher. Finally, it is worth noting that EPS estimates continue to fall, which represents a significant risk moving into 2019.
Disclosure: At the time of publication, Mr. Moenning held long positions in the following securities mentioned: none - Note that positions may change at any time.
The opinions and forecasts ...
more

