
Is Enough Baked In?

After a very scary decline and then an impressive rally, the question most investors are probably asking themselves is, where are we now?
In order to get our bearings, let's review where we've been. Recall that as of the market close on Christmas eve, the bears had pummeled the S&P 500 for a loss of -19.78% from the September 20th high water mark. Through December 13th, the decline had been orderly and fairly well contained. There were worries over this and that, but since the February/March lows had not been exceeded, a great many analysts (including yours truly, truth be told) were calling the action a garden-variety correction.
But then the bottom fell out. Over the next 7 sessions (one of which was a half-day), the S&P dove an eye-popping -11.3% as technical levels snapped like toothpicks, algos ran in high gear, and a bearish market environment took hold.
The thinking was the market was facing a triple threat of negatives that would surely end in the type of bear market cycle last seen in 2007-09 and 2000-02. It was a combination of fears over (1) the Fed overshooting again and pushing the economy into recession, (2) the trade war with China dragging on and sending the global economy into recession (or deeper into recession, depending on who you talk to), and (3) the simple fact that both earnings and economic growth were slowing both at home and abroad.
So, there it was. A bearish narrative that by late December became hard to argue with. This was going to end badly, we were told. Credit conditions were tightening - a lot as folks began to realize that a boatload of low-quality debt needed to be refinanced soon. The words contagion and systemic risk began making the rounds. Funds began to blow up. Forced sales started happening. Market models of all shapes, colors and sizes flashed red. And after a -15.74% drubbing in just 14 days between December 3rd and 24th, it certainly felt like the stock market was experiencing Déjà vu all over again and that the bad old days of the Financial Crisis had returned.
Instead of a run-of-the-mill correction, it now appeared that a bear, of the big, bad variety, was upon us. All hope was lost. To borrow a phrase from Mr. Jeff Macke, there were only two positions that mattered, cash and fetal.
A Funny Thing Happened On The Way To The Debacle
But just when it looked and felt like the world was about to end, one Kris Kringle showed up at the corner of Broad and Wall. Loaded with a sleigh full of toys - and some magic words from Jerome Powell - the Santa Claus rally began in earnest. Sure, Mr. Claus was a tad late. But when the U.S. and China started talking turkey about a deal, the mood suddenly changed, and the traditional Santa Claus rally ripped higher.
Fast forward to today. Suddenly, investors find themselves with a rally that has propelled the S&P 500 up +10.43% in just 12 days. Suddenly, one of the three big threats has been solved (the Fed looks to be on hold) and another appears to be on its way to being, at the very least, mitigated (i.e. it looks like the trade war will get solved). And given that valuations are suddenly a lot better than they were even a few months ago, some folks are arguing that the third big threat (slowing growth) is already baked into the cake.
#GrowthSlowing - Is Enough Baked In?
Let's think this through. The S&P fell almost 20% on the back of the three big worries. Two of those worries appear to be handled. As a result, the S&P is now off -11.41% from its peak. So, the question becomes, is a drop of 11.4% enough to account for the slowdown in earnings that everyone is expecting?
To be sure, earnings expectations are heading lower - and at a rapid rate. Here's a chart of calendar-year EPS estimates over time that makes this point clear...

View Chart Online
Source: Ned Davis Research
Note the steep decline in the salmon-colored line (which represents EPS estimates for 2019) in the upper right. The only other time estimates dove this fast was back in 2015 (and to a lesser degree, in 2016) as the oil crash took its toll on earnings.
So, as we enter earnings season, the key question is if earnings estimates have been knocked down enough to reflect the reality of slowing global growth. Currently, it looks like EPS estimates for full-year 2019 is down about $6.00 (approximately 3.4%) from the levels that were being projected back in the fall.
According to FactSet, EPS for the upcoming earnings parade (Q4 2018) is currently expected to grow by 10.6% on a year-over-year comparison basis. It is worth noting that a 10.6% gain would represent a 5th consecutive quarter of double-digit earnings growth. So, this is where the earnings "bar" is currently set.
From my perch, unless Powell & Co. change course again or trade negotiations break down completely, earnings will now become the key focus. As such, the always fun game of reality versus expectations during earnings season is likely to control the action in the near-term.
While I run the risk of earning a Captain Obvious tag here, guidance and management commentary is going to be critical during the upcoming earnings parade. Rest assured that you are going to hear the words, China, slowdown, wage pressures, and increasing costs a lot. From my seat, it is the degree to which these words are used and the overall tone of forward guidance that will tell us whether current prices in the stock market are too high, too low, or about right. We shall see.
Weekly Market Model Review
Now let's turn to the weekly review of my favorite indicators and market models...
The State of the Big-Picture Market Models
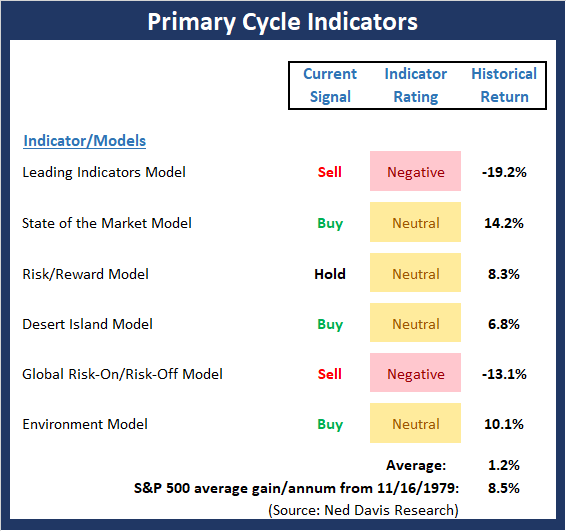
I like to start each week with a review of the state of my favorite big-picture market models, which are designed to help me determine which team is in control of the primary trend.
View My Favorite Market Models Online
The Bottom Line:
- For the third week in a row, there are important changes on the Primary Cycle board. And for the second week in a row, the changes are to the upside. First, the "State of the Market" Model flashed buy signal. Ditto for my "Desert Island" Model and the Environment model. And in each case, the model reading improved. While it is nice to see some Buy signals back on the board, the bulls still have some work to do in order to get the model readings up into the positive zone.
This week's mean percentage score of my 6 favorite models improved to 46.1% from 40.3% (2 weeks ago: 36.5%, 3 weeks ago: 41.9%, 4 weeks ago: 47.8%) while the median rose to 55.0% from 50.0% (2 weeks ago: 44.0%, 3 weeks ago: 44.2%, 4 weeks ago: 45%).
The State of the Trend
Once I've reviewed the big picture, I then turn to the "state of the trend." These indicators are designed to give us a feel for the overall health of the current short- and intermediate-term trend models.

View Trend Indicator Board Online
The Bottom Line:
- The bears contend that the stock market is in the midst of a classic dead-cat bounce. However, the bulls counter with the idea that one of the three negative drivers of the market action has been resolved (the fear of a Fed overshoot), one is in the process of being resolved (the trade war with China), and the third (slowing growth) has already been "baked in" to current prices. In my opinion, how the S&P 500 acts given the important overhead resistance and the start of the earnings season will likely settle the argument.
The State of Internal Momentum
Next up are the momentum indicators, which are designed to tell us whether there is any "oomph" behind the current trend.

View Momentum Indicator Board Online
The Bottom Line:
- The message from the Momentum board is that from a short-term perspective, the action has been quite strong. But from an intermediate-term standpoint, there is still a lot of work to be done to repair the technical damage. The good news is that we have seen some "breadth thrust" signals lately, which is something that was lacking during the April-September 2018 rally. This suggests that once the testing/basing process is completed, a new upleg in the ongoing secular bull is likely to emerge.
The State of the "Trade"
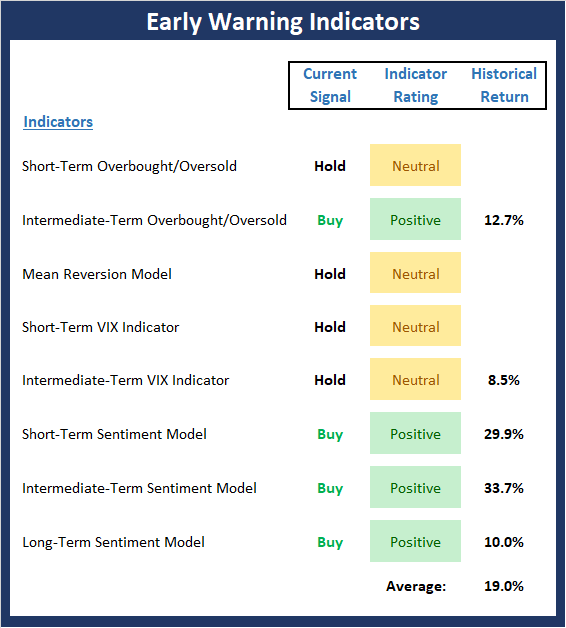
We also focus each week on the "early warning" board, which is designed to indicate when traders might start to "go the other way" -- for a trade.
View Early Warning Indicator Board Online
The Bottom Line:
- The positive tailwinds from the shorter-term oversold, mean reversion and VIX indicators have now been worked off and are all now very close to the levels that tell us it is "time to go the other way." However, the good news is the intermediate-term indicators, as well as the sentiment readings all, continue to favor the bulls.
The State of the Macro Picture
Now let's move on to the market's "environmental factors" - the indicators designed to tell us the state of the big-picture market drivers including monetary conditions, the economy, inflation, and valuations.

View Environment Indicator Board Online
The Bottom Line:
- There continues to be improvement in our External Factors board. Last week, I reported that the monetary composite had upticked in response to the pullback in rates and that the inflation model was now solidly green. This week, it is important to note the improvement in the Valuation Composite, where the signal moved from sell to hold and the rating improved to neutral from negative. For me, the message here is clear: While valuations are clearly not a tailwind for the bulls, they are also no longer a strong headwind.
Disclosure: At the time of publication, Mr. Moenning held long positions in the following securities mentioned: none - Note that positions may change at any time.
The opinions and forecasts ...
more


So a decline in earnings has become neither a major headwind or tailwind for stocks. That is murky at best. But it is an interesting article.