
Is Current Stock Market Sentiment A Contrarian Indicator?
Heading into the jobless claims report from the week of December 8th, some investors were wondering if the claims were turning higher which would signal the end of this cycle. They had bottomed at 202,000 in September and reached 231,000 in the week of December 1st. That’s not a huge turn, but investors like to anticipate the weakness in order to profit. Claims are volatile and such a small percentage change could easily be noise.
Also, we showed how the non-seasonally adjusted claims had relative strength in a previous article. There are a lot of seasonal adjustments around holidays like Thanksgiving. One way to avoid mistaking a signal for noise is determining if there is a one time event which affected claims. There wasn’t one which pushed them higher, but the seasonal adjustment could be blamed partially.
The latest jobless claims report switched the narrative from wondering about a potential recession, to wondering if the metric will hit a new cycle low. The previous week’s report was revised to 233,000. The latest report fell to 206,000 which is just 4,000 above the September low. This beat estimates for 228,000 and the low end of the expected range which was 225,000. There weren’t any one-time factors once again.
This was an unusual report. As you can see from the chart below, the 27,000 weekly decline in initial claims was the largest since the week of April 25th, 2015 when it fell 28,000.
(Click on image to enlarge)
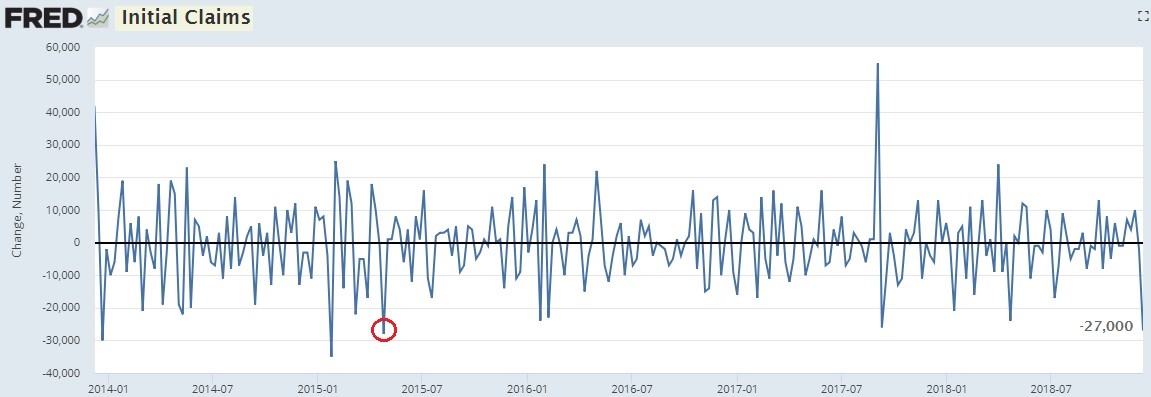
Source: FRED
This report can easily be revised higher and it might be a blip which is quickly reversed. The only thing we know for certain is we know nothing. The increase in the prior few weeks wasn’t enough to base a bearish thesis around yet and this report doesn’t mean the economy is about to accelerate.
Is The Labor Market Full?
The record low jobless claims in relation to the size of the labor market suggests the labor market is full. That and the lowest unemployment rate since December 1969 support the Fed’s rate hikes. However, not every indicator agrees with that analysis. In a previous article we reviewed the prime age employment to population ratio which doesn’t signal the labor market is full.
As you can see from the chart below, the percentage of people unemployed for longer than 27 weeks is much higher than the past 2 cycle troughs.
(Click on image to enlarge)
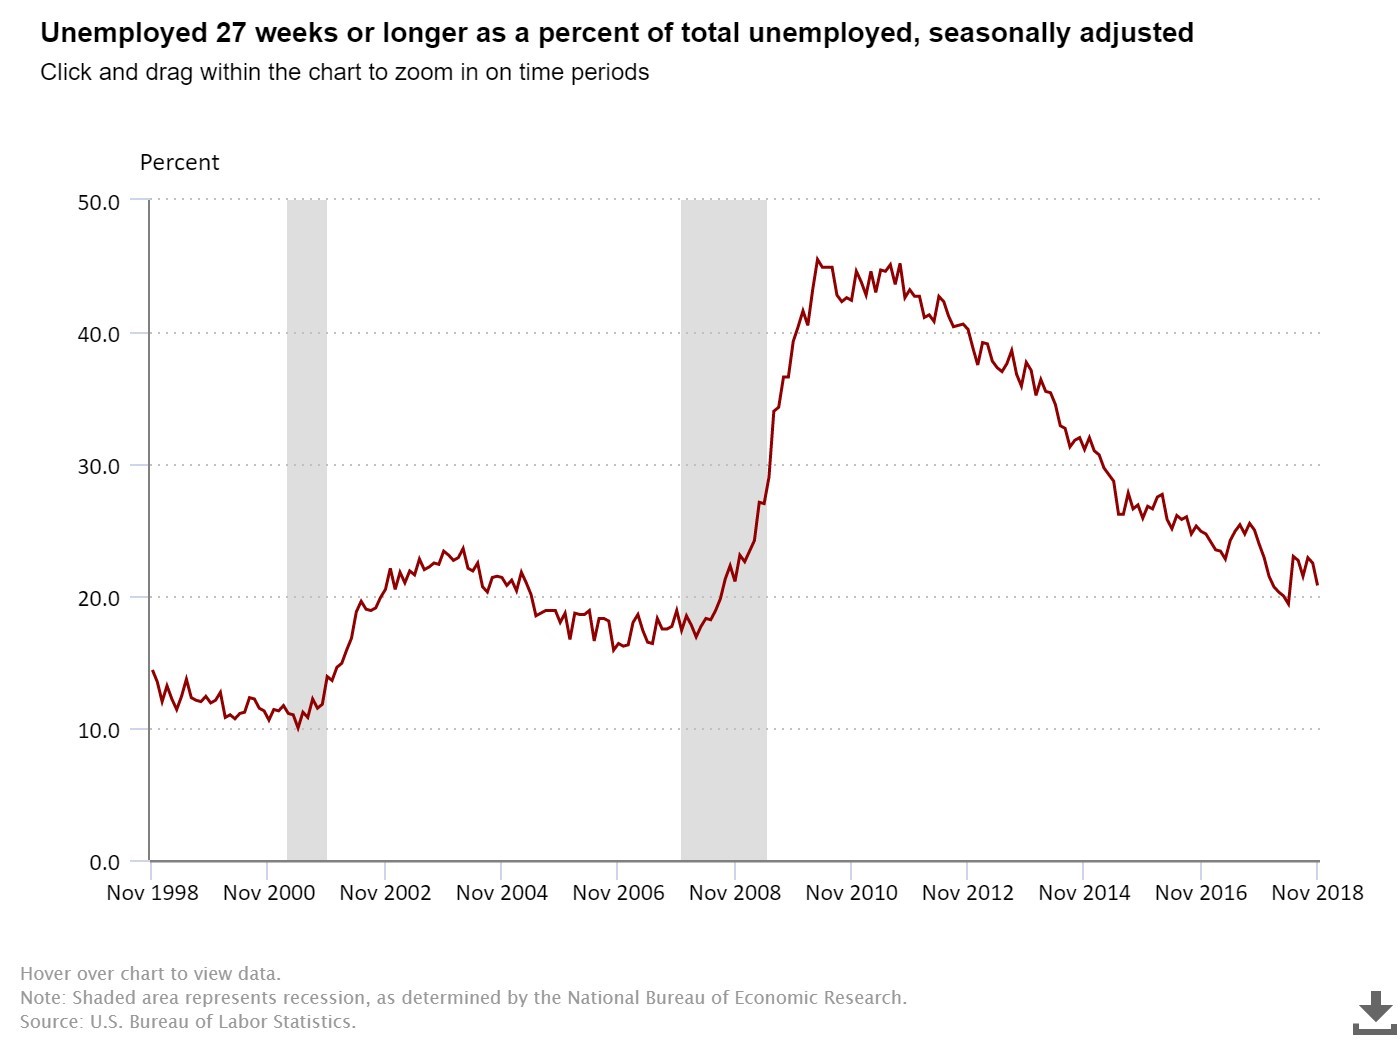
Source: BLS
Currently it is at 20.8%. It troughed at 15.9% in October 2006 and 10% in May 2000 which was during the 2001 recession. When workers are unemployed for a long time, it signals they are having difficulty getting jobs. This cycle has been long because so many people became detached from the labor force and were on the sidelines for the long term. This metric and the prime age employment to population ratio suggest there is still labor supply left in the labor market’s pool of workers.
Unique Situation In The Cycle
If the yield curve is correct, the next recession could be over 1.5 years away. Even though the jobless claims and ISM PMI reports remain strong and GDP growth is expected to be 3% in Q4, traders are acting like the next recession is coming in the first half of 2019. Retail investors are getting worried as 48.9% of traders think the S&P 500 is going to fall in the next 6 months. That’s up 18.4% from the previous week’s reading. It is the highest reading since April 11th, 2013.
In the survey, cash allocations hit a 33 month high, which is a bullish sign. However, only 13% see a recession in the next year. With stocks already down over 10%, it’s odd to see traders thinking stocks will fall more without a recession. It seems like they are basing all their opinions on the recent past. Either stocks will rally in the next 6 months or economic growth will slow.
As you can see from the chart below, the AAII survey shows 20.9% of investors are bulls which is still above the 2016 low.
(Click on image to enlarge)
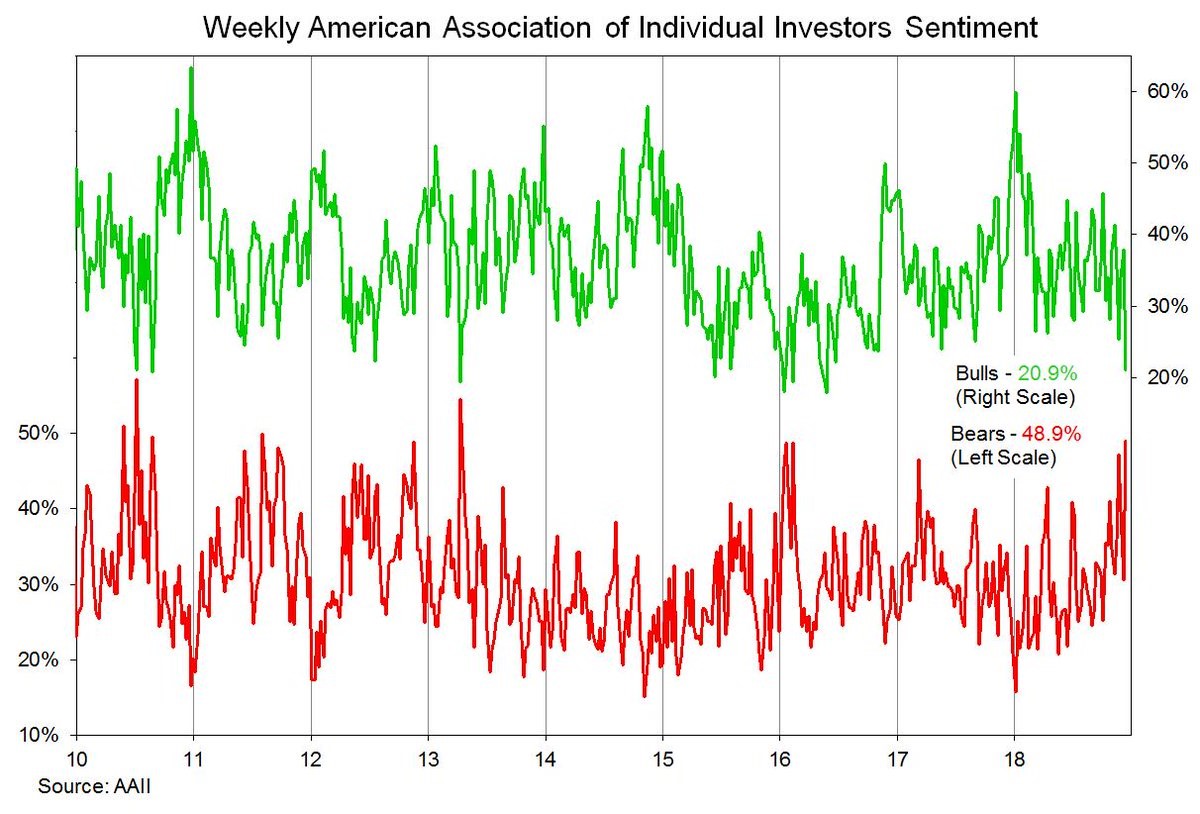
Source: American Association Of Individual Investors
However, 48.9% of traders are bears which is the highest since 2013. These negative sentiment readings are a good signal stocks will move higher. After the weak April 2013 reading, stocks moved up 16% to end the year.
EBITDA Profit Margins Haven’t Fallen Yet
We say this is a unique point in the cycle because the correction is happening fairly early. If there ends up being a recession in mid-2020, that means stocks peaked about 21 months before the recession if the September high is the final peak. It’s a weird scenario because if you buy stocks now, you will be holding them into an economic weak period. However, if you’re short you’re betting on a bear market way before the recession. This is what makes markets difficult to predict. Even knowing where the economy is headed, doesn’t mean you can time the market perfectly.
The chart on the left shows the PE ratio has already fallen even though EBDITA profit margins are still high.
(Click on image to enlarge)
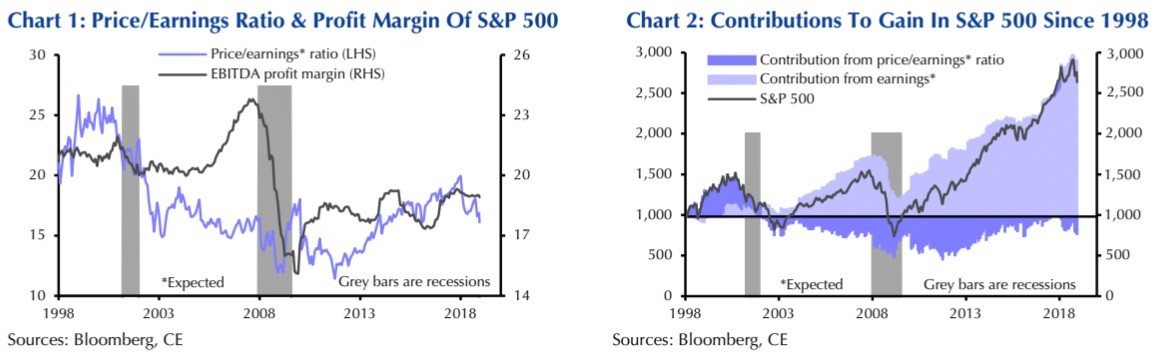
Source: Capital Economics
There has been severe multiple compression in 2018. If stocks keep falling, they will eventually price in a recession which might make them a buy even if the economy weakens. There’s always a price you can make money on an asset. The chart on the right shows the recent earnings acceleration since 2016 which powered stocks higher following the election.
One Positive & One Negative Chart
The positive chart below shows consumer discretionary stocks underperform the S&P 500 a few years before recessions.
(Click on image to enlarge)
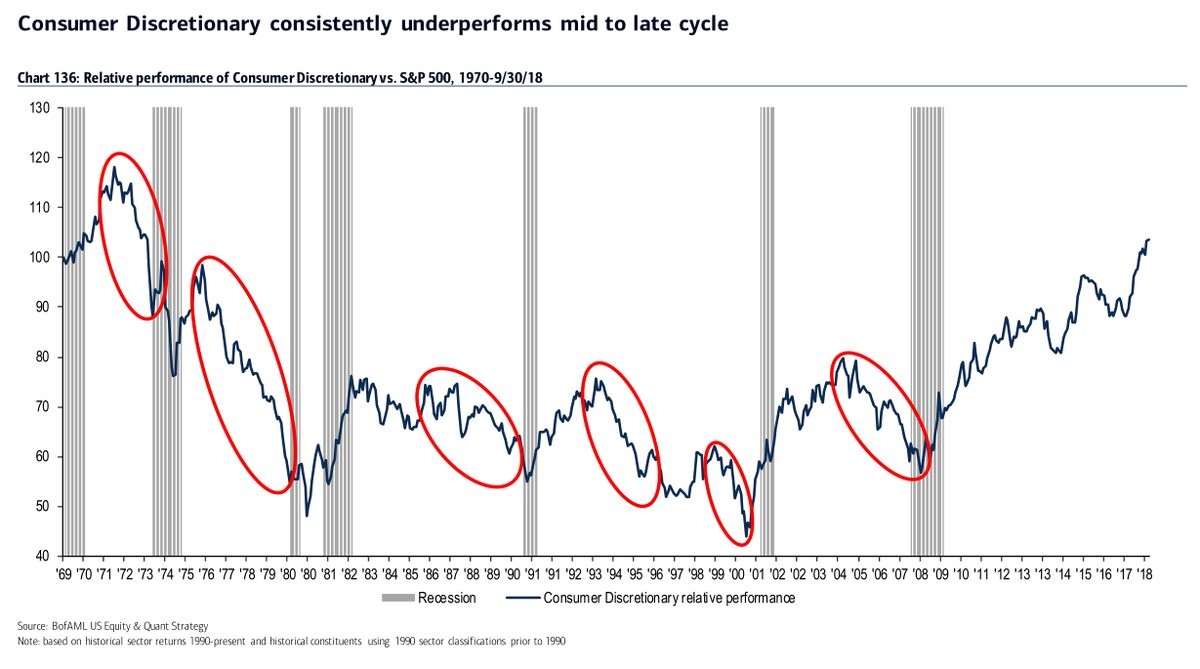
Source: Merrill Lynch
As of September 30th, consumer discretionary had been on par with the S&P 500. From October 1st to December 13th, the consumer discretionary sector is down 10.5% which is slightly worse than the 9.75% decline in the S&P 500. This slight underperformance still doesn’t suggest a recession is coming soon.
The negative chart below suggests a recession is coming.
(Click on image to enlarge)
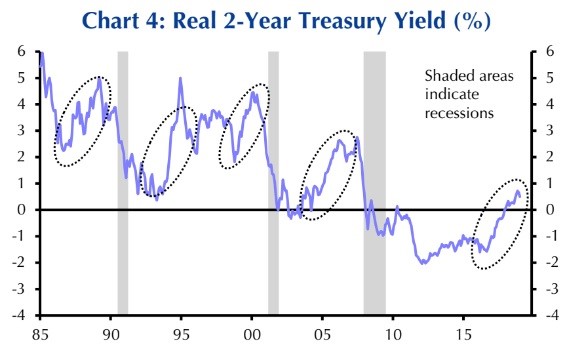
Source: Capital Economics
The real 2 year treasury yield increased a few years before the past 3 recessions, similar to what’s happening now. Both charts show a false recession indicator in the early 1990s. Interestingly, the difference between America’s 10 year real yield and international 10 year real yields is at a record high.
Conclusion
Those calling for a recession in the beginning of 2019 because jobless claims were rising and stocks were falling, were proven incorrect by the recent decline in jobless claims. It is volatile signal with a lot of noise. There’s no recession signal yet. Economic growth is slowing, which justifies the correction in stocks. The question is if stocks can fall into a bear market far before a recession hits. It’s not even certain a recession will occur in 2020 because the 10 year yield never fell below the 2 year yield.
Disclaimer: Please familiarize yourself with our full disclaimer here.


