Is A Rally Off The Lows Bullish?

So many are so quick to call a bottom once the market makes a new low or comes close to the recent lows, and then rallies.
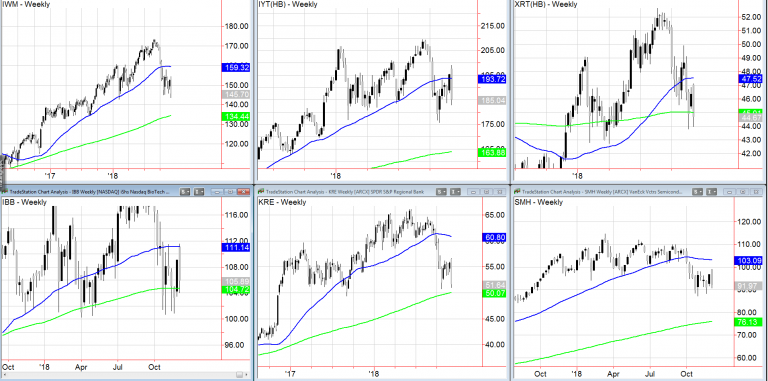
When this type of trading occurs, I like to go out to the weekly charts.
And, I like to look at the weekly charts in my economic Modern Family.
Why?
Perspective.
First, it cuts out a lot of noise when you go out in time.
Secondly, it helps you see the difference between a day trader’s mentality and that of a swing trader.
Finally, it shows you where the money is going to and flowing away from.
What do the weekly charts say now?
Beginning with the Russell 2000 IWM, this is the most compelling at the moment.
It made a new 2018 low early today and then rallied on better than average volume closing at the top of the intraday range.
However, before we call out the bull cry, we would like to see it confirm tomorrow with a close above Thursday’s high (147.20).
Next is Transportation IYT. The chart is sloppy but clearly shows that it’s not anywhere near the major support or resistance right now.
That means, after lots of folks got burnt buying the strength in this last week, now, folks are more cautious.
After that is Retail XRT. Best news is that it held the recent low at 43.75. If it can close tomorrow over 45.00, then we have a clean risk for a potential bounce.
Then comes Biotechnology IBB. Here is another place investors got hurt buying strength. The good news here is that it tested yet held the 200-week moving average. 104 is the key support now.
Next is Regional Banks KRE. With the 200 WMA at 50.07, this got real close today. Yet, it did not fail its recent swing low at 50.69.
If the market gains more confidence, a risk below 50.00 is not so bad.
Finally, there is Semiconductors SMH. With the recent low at 86.95, today that it held 90.00 is good.
The weekly chart does not look great, so we do not think a bottom here. Rather, we think perhaps another attempt at 95.00-97.00.
This gives you some parameters to look at. It also shows that the Russell’s, Regional Banks and Retail have the best chance to see money rotation into them.
Now, let’s not forget the rates, dollar, and oil.
In the macro picture, rates through TLT, look like it topped out today. Initially, that could be positive. However, the market is still spooked by the Fed’s hawkish position, even when they capitulate.
Maybe especially when they capitulate.
The dollar has not definitively told us yet is it is topping. And oil through USO, tested recent lows, held them and might be ripe for a move to around 11.50.
Put this all together, and we see another tradeable bounce, but feel reticent to say “bottom.”
S&P 500 (SPY) Confirmed Distribution phase. 270 is the number this must clear and hold yet even if it does, SPY has its work cut out for it to get back to 276. The big support at 262.50 held.
Russell 2000 (IWM) 150.50 the best overhead resistance and now 147 pivotal then 145 support
Dow (DIA) Confirmed Distribution phase. 250 resistance with 255 bigger resistance. Held 242 next
Nasdaq (QQQ) Needs to move back above 170 and hold 160.00
KRE (Regional Banks) 52.20 pivotal for tomorrow-above worth a shot.
SMH (Semiconductors) Major resistance at 97.00 and back into a confirmed Bearish phase. Support at 90.00
IYT (Transportation) A move back over 190 maybe a relief
IBB (Biotechnology) Bearish phase with 104.75-105 the must hold support.
XRT (Retail) 45.00 pivotal 44.00 support and 47.50 resistance
Disclosure: None.


