
Investors Enter New Year With Combination Of Apprehension And Optimism
After an “investor’s paradise” year in 2017 – buoyed by ultra-low levels of volatility, inflation, and interest rates, and fueled even more by the promise of fiscal stimulus (which came to fruition by year end) – 2018 was quite different. First, it endured a long overdue correction in February that reminded investors that volatility is not dead, and the market wasn’t quite the same thereafter, as investors’ attention focused on escalating trade wars and central bank monetary tightening, leading to a defensive risk-off rotation mid-year and ultimately to new lows, a “technical bear market” (in the Nasdaq and Russell 2000), and the worst year for stocks since the 2008 financial crisis. Then, it was confronted with the Brexit negotiations falling apart, Italy on the verge of public debt default, violent “yellow vest” protests in France, key economies like China and Germany reporting contractionary economic data, and bellwether companies like FedEx (FDX) and Apple (AAPL) giving gloomy sales forecasts that reflect poorly on the state of the global economy. The list of obstacles seems endless.
Moreover, US stocks weren’t the only asset class to take a beating last year. International equities fared even worse. Bonds, oil and commodities, most systematic strategies, and even cryptocurrencies all took a hit. A perfect scenario for gold to flourish, right? Wrong, gold did poorly, too. There was simply nowhere to hide. Deutsche Bank noted that 93% of global financial markets had negative returns in 2018, the worst such performance in the 117-year history of its data set. It was a bad year for market beta, as diversification didn’t offer any help.
Not surprisingly, all of this has weighed heavily upon investor sentiment, even though the US economy, corporate earnings, and consumer sentiment have remained quite strong, with no recession in sight and given low inflation and interest rates. So, despite the generally positive fundamental outlook, investors in aggregate chose to take a defensive risk-off posture, ultimately leading to a massive selloff – accentuated by the rise of passive investing and the dominance of algorithmic trading – that did huge technical damage to the chart and crushed investor sentiment.
But fear not. There may be a silver lining to all of this, as it has created a superb buying opportunity, and it may finally spell a return to a more selective stock-picker’s market, with lower correlations and higher performance dispersion. Moreover, my expectation for 2019 is for a de-escalation in the trade war with China, a more accommodative Fed, and for higher stock prices ahead. Forward valuations overall have become exceedingly attractive, especially in the cyclical sectors that typically flourish in a growing economy.
Market Commentary:
2018 performance review and economic metrics:
Whereas 2017 was characterized by risk-on behavior and strong performance in the Momentum factor at the expense of Value, Quality, and Low-volatility factors, 2018 was marked by a risk-off flow of capital such that changed the market’s complexion entirely. The S&P 500 fell by -9% (total return) in December alone and lost -4.4% for full-year 2018 (versus +22% return in 2017, and -14.5% below its all-time high from September 21), while the S&P 500 Equal-Weight (RSP) was down -7.8% in 2018 (versus +18.5% in 2017), S&P 500 Growth (SPYG) was flat (versus +28% in 2017) and S&P 500 Value (SPYV) returned -9% (versus +15% in 2017). Also, S&P 400 mid-caps (MDY) was -11% in 2018 (versus +16% in 2017) and S&P 600 small caps (SLY) returned -9% (versus +13% in 2017). Note the continued outperformance of cap-weighted and growth-oriented over equal-weighted and value-oriented, and large caps over smaller caps in both the up-market of 2017 and the down-market of 2018, largely driven by capital flows into passive vehicles and algorithmic trading versus research-driven stock picking. More on this later.
S&P Dow Jones Indices reported that Healthcare was the top-performing sector across the cap spectrum. Among large caps, the only positive sectors were Healthcare, Utilities, and Consumer Discretionary. In mid-caps, Healthcare and Utilities were the only positive sectors, while in small caps, only Healthcare was positive. Energy was the worst performing sector across the cap spectrum (especially in the small cap space), hurt by the decline in oil prices, as oil closed the year around $46, which was down -23% from the $60 closing price at the end of 2017.
For the first half of 2018, US stocks were led by the mega-cap Technology names like Amazon (AMZN), Microsoft (MSFT), and Apple (AAPL), that dominate the cap-weighted market indexes, along with risk-on sectors like Technology (including semiconductors), Consumer Discretionary, Steel, Energy, and small caps. But starting on June 11, when the trade war with China escalated from rhetoric to reality, capital quickly rotated out of those risk-on market segments and into US large-cap defensive sectors like Healthcare, Utilities, Consumer Staples, and Telecom, as well as some mega-cap stalwarts. The table below illustrates this pre- and post-June 11 behavior, through the end of the year.
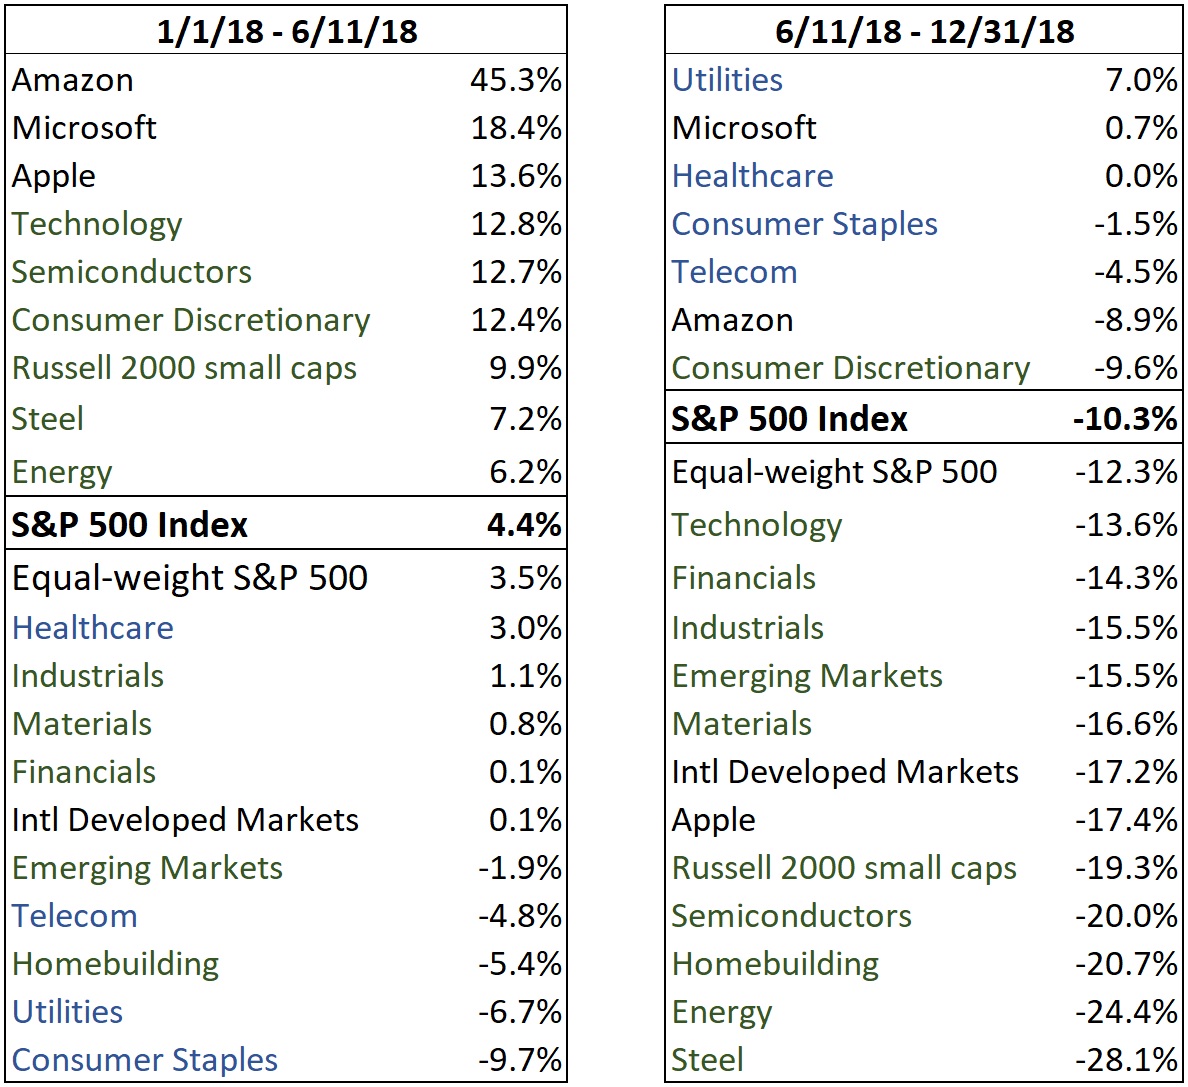
Even though the outlook for the cyclical sectors held up, with earnings beats and raised guidance, prices fell precipitously as investors feared the uncertain impacts of trade wars and Fed policy. It seemed nobody believed the guidance and they didn’t want to be last one out the door.
But the US economy is showing no signs of an imminent recession. During 2018, final Q1 GDP came in at a 2.0% annual rate, Q2 was 4.2%, and the BEA’s third estimate for Q3 (published on December 21) was 3.4%. Looking ahead, the Atlanta Fed’s GDPNow model (as of January 8) is forecasting 2.8% for Q4, while the New York Fed’s Nowcast model (as of January 4) forecasts Q4 at 2.5% and 2.1% for 1Q2019. Overall, the Federal Reserve expects the final 2018 full-year growth rate to be in the range of 3.0-3.1%, followed by 2.3-2.5% in 2019. The IMF forecasts global growth of 3.7% in 2019, which includes 2.5% GDP growth for the US. Brian Wesbury, Chief Economist at First Trust Advisors L.P., is forecasting 3.0% U.S. economic growth in 2019 as the benefits from tax reform and deregulation play out over the next several years.
Other metrics look quite good, too. Employment is strong, as nonfarm payrolls had a blowout report in December showing 312,000 new jobs, which was the biggest jump since February. Average hourly earnings increased an impressive +3.2% year-over-year, which is the best growth rate since 2008. Unemployment remains low at 3.9% and the labor participation rate rose (i.e., more people returned to the job market). Moreover, Jobless Claims remains near the lows of the economic expansion (note that prior to every recession since 1970, the number of jobless claims was on the rise). Consumer and business confidence both remain near record highs. Consumer spending is strong, as holiday retail sales hit all-time records, and DataTrek reports that sales of large pickup trucks in 2018 outpaced 2017, as “…key buyers here (small businesses) clearly still feel positive about their near-term outlook.” Furthermore, operating leverage of households and businesses is not unusually high, nor is household and business capital spending (as percentage of GDP). A lot of institutional capital is idle and needs to be deployed to hit return targets. In addition, the 10-year yield has fallen well below 3%, which justifies higher equity valuations (both on a discounted cash flow basis and on a relative valuation basis versus bonds).
US corporate profits in 2018 grew nearly 20% (of which about half was organic growth and half attributable to the tax cut), which was the fastest pace since 2010. For 2019, earnings growth for S&P 500 companies is forecasted to be a slower-but-still-healthy 9% for full-year 2019 (to about $173 per share), so although earnings momentum may be slowing, it is nowhere near contracting. Also important to note, the long-term earnings growth rate (looking beyond 2019) recently has increased, as analysts see more favorable opportunities ahead – essentially pushing out some sales that were previously expected in 2019 to 2020-2021. Thus, when you couple the positive earnings expectations with low inflation and interest rates, higher stock valuations (e.g., P/E multiples) certainly seem justified, as opposed to the dramatic compression in forward P/E ratios we saw in 2018, which was more reflective of a climate of earnings contraction, rising interest rates, and economic recession.
This all supports the notion that the US economy is trying to launch into the elusive “boom phase,” which should be quite favorable stocks. I agree with Dubravko Lakos-Bujas of JP Morgan, who recently wrote, “We expect the equity pain trade to be on the upside, given diminishing tariff and Fed related risks, positive earnings growth, attractive valuations, continued shrinkage of equity supply via buybacks, and given very low investor positioning.” Thus, even beyond 2018, it seems that US stocks have some years left in this uptrend.
Assessment of my 2018 forecasts:
As for my beginning-of-year forecasts for 2018 (which I derived from the consensus earnings outlook and underlying assumptions suggested by Sabrient’s models), I predicted a solidly up market, fueled by new fiscal stimulus, strong corporate earnings, persistently low inflation, and only a modest rise in interest rates. I expected Treasuries to catch a bid whenever the 10-year yield rose above 3.0% (essentially capping any spike in yields). I also predicted some compression in forward P/E ratios – from 18.5x in the S&P 500 at the start of the year to perhaps 17x by year end – as the speculative move in stocks during 2017 in anticipation of tax cuts gave way to a “show me” mentality among investors about how corporate leaders would actually deploy their extra cash to build value in their companies’ stock. In addition, I pointed out some risks to my thesis, particularly the uncertain impacts from the gradual deleveraging of massive levels of global debt and an overly hawkish Federal Reserve.
Well, we indeed saw inflation and long-term Treasury yields remain low and P/Es compress, as I expected. But I didn’t foresee the persistently defensive risk-off investor sentiment (essentially for all of 2H2018) that resulted in a far lower 10-year yield and far greater P/E compression. The forward P/E started the year at about 18.5x and finished the year around 14.5x (rather than the 17x that I predicted – with even more startling moves in cyclical sectors, such as steel, which fell to below 7x (from 14x at the start of 2018) and banks at less than 10x (from 15x). As a result, the S&P 500 closed the year well short of my year-end target of 3,000, although it did reach as high as 2,941 in late September – but even then it was not displaying the bullish conviction necessary to march higher. I also predicted elevated volatility and a “significant correction” during the year, but I thought (and still think) it would mark a healthy cleansing that ultimately leads to higher prices for the following few years – “barring any major disruptions from the myriad geopolitical risks.” The trade war with China certainly qualifies as such, but again, I believe it will soon find a conclusion. As we start 2019, the market is trying to climb its way out of that “significant correction,” as formal trade negotiations with China resume and the Fed tamps down on its hawkish language.
Even as the broad market averages continued to move higher into late September, I was opining that the market wouldn’t be able to continue to hit new highs solely on the backs of defensive risk-off sectors and a few mega-caps – the cyclicals would have to reassert leadership. But instead, the defensive rotation turned into a full-blown selloff. Prominent hedge fund manager Cliff Asness of AQR Capital, a massive quant-based liquid alternative fund, called 2018 a “George Costanza market,” in reference to the Seinfeld TV show episode in which George started doing everything opposite of what he would normally do and suddenly found great success. Mr. Asness observed that doing the exact opposite of what his long-standing and highly-successful model has directed would have worked much better. But does this mean he intends to abandon his proven approach that has worked so well for so long? Not by a long shot.
Likewise, Sabrient does not intend to abandon its successful growth-at-reasonable-price (GARP) approach of buying stocks with strong expected earnings growth and sound earnings quality that are selling at attractive forward valuations just because investors chose to suddenly (and likely temporarily) ignore solid fundamentals and move into defensive names with reliable revenue streams but only modest earnings growth and high forward P/E ratios. Our model, which aggregates the forward estimates of the many sell-side analysts who cover the universe of US-listed companies, has consistently suggested that the economy still has legs and remains bullish on many of the cyclical market segments, with the notable exception of Semiconductors (which are indeed displaying negative earnings growth due to oversupply). The only reason that stocks shouldn’t be rising right now is if all the good metrics are destined to suddenly reverse – such as due to an escalating and protracted trade war – leading analysts to slash estimates across the board. But such a case does not appear at all likely, and slightly-lower but still-solid earnings growth in a low-interest rate environment is not a formula for a market crash. Unless you are technical trader who follows short-term price action, fundamentals and forward valuations suggest we have been presented with a buying opportunity in stocks, with limited downside and attractive upside.
Interest rates:
The extremely weak investor sentiment late in the year also caused a rotation of capital into bonds such that the 10-year Treasury yield fell below the 3.0% level to close the year at 2.69% (which was only 29 bps above the close of 2017, although the 10-year yield hit 3.25% in October), while the 2-year closed the year at 2.50%. So, the closely-watched 2-10 spread persistently flattened throughout the year, closing at only 19 bps (and at one point had narrowed to a mere 10 bps), which generated worries of a potential “Fed inversion” of the yield curve if the Fed were to keep raising rates on the short end. But many market veterans prefer to watch the 3-month T-bill, which closed 2018 at 2.38%, versus the 10-year T-note, and this spread displayed a less worrisome (but still contracting) 31 bps spread at year end. Notably, the 10-year yield continued to fall during the first week of 2019, falling to as low as 2.55%.
Investors were relieved to hear the Federal Reserve soften its hawkish (or perhaps indifferent) tone, in recognition of the highly-leveraged global economy’s sensitivity to rising interest rates and an overly strong dollar. After the Fed hiked another 25 bps at the December meeting, the fed funds rate currently sits at 2.5% (top end of range). M2 money supply is now growing at 4%, which is its lowest rate in six years. Personal consumption expenditures (PCE) remains at or below 2.0% (with core PCE at 1.8%). TIPS spreads are low, with the 5-year spread suggesting only 1.7% inflation. In response, the Fed announced it can be "patient and flexible" regarding further rate hikes, with no preset path in policy, which indicated to investors a likely slowdown. Of course, the Fed reaffirmed unwavering confidence in the US economy and its ability to absorb higher rates, but it also pledged to listen to the markets and noted that the “autopilot” unwinding of its balance sheet didn’t imply they wouldn’t be willing to make adjustments as appropriate. Chairman Jay Powell seems to have finally acknowledged that it matters when liquidity is pulled out of the system and interest rates rise on a heavily-indebted economy. Thus, I think the Fed is unlikely to hike more than once this year, if at all, but it didn’t want to spook markets by being hyper-reactive or seeming to be worried all of a sudden about the sustainability of economic growth.
Fed funds futures are already pricing in more dovish behavior, which has helped to calm markets and foster some resurgence in bullish conviction. CME Group fed funds futures currently place the odds of a rate hike this month at zero, and 29% by June. But interestingly, by the end of 2019, there is now a 97% chance that there will be no more than one additional rate hike by the end of 2019 (i.e., a fed funds rate of 2.75% or less), a 74% chance that there be no rate hikes at all, and a 9% chance of a 25-bps cut.
Volatility, the curse of the algos, and weak investor sentiment:
There is no denying that volatility returned in 2018. After averaging a daily closing price of only 11.0 during 2017, the CBOE Volatility Index (VIX) averaged 16.6 during 2018 (that’s 50% higher!). DataTrek pointed out that for 2018, the S&P 500 gained or lost at least 1% on 64 trading days (equally split 32/32 between up days and down days), compared to only 8 such 1% moves in 2017 and an annual average of 53 since 1958. And as if to put a punctuation mark on it, during the week before Christmas the Dow posted its worst weekly performance since the Financial Crisis 10 years ago as it dropped over 1,700 points, and then the day after Christmas gave us the biggest single positive day in history when the Dow rose over 1,000 points. Whew. Shell-shocked investors perhaps had forgotten what volatility really was. But it has to be acknowledged that despite the spike in volatility in 2018, from a historical standpoint it was only a moderately volatile year. Yes, the average VIX level was higher than the prior two years, but there was rarely an indication of real investor panic. Only one day (Feb 6) did it breach the 50 mark, and only 11 days breached 30. Moreover, both the CBOE put-call ratio and the TRIN ratio (advancers versus decliners) both suggest investors didn’t really panic. But it was enough to shake out a lot of complacency and remind us that risk management still matters.
So, what’s been the main cause of this elevated volatility? And what does the future hold?
For starters, nine years (2009-2017) of sole reliance on Fed monetary policies like zero-interest-rate (ZIRP) and quantitative easing (QE) created both asset inflation and asset correlation. Regular readers of mine know that I have long questioned the broad characterization of those years as a continuous “boom” cycle that was overdue for a recessionary “bust.” Instead, my view has been that a weak global economy coming out of the Financial Crisis was merely propped up by historic monetary stimulus in the form of global QE, ZIRP in the US, and even negative interest rate policy (NIRP) overseas. This gave rise to tremendous asset inflation that pushed stocks, bonds, and real estate to new highs. But alas it only benefited those who already owned assets – and the more you owned the better you did – which led to a wealth gap and income inequality and ultimately a global populist movement, chilling calls for socialism, and a vitriolic divisiveness permeating society that has all but eliminated civil discourse, much less compromise. After seeing a global rise in populism essentially starting in 2016 (marked by Brexit and the US election of Trump), 2018 became the year in which populist governments were elected in places like Italy, Mexico and Brazil, which included a general rejection of austerity (witness the “yellow vest” protests in France), as well as increased spending, lower taxes, and higher deficits – which is unusual to see during economic expansions.
The asset inflation masked some festering difficulties under the hood. We endured a two-year corporate earnings recession from mid-2014 through mid-2016 and what might be characterized as a “capex strike” for much of the past 10 years, as share buybacks, dividend payments, and M&A all exceeded capital investment. This was not reflective of a robust economic cycle, as capex spending has fallen well short of prior economic cycles. In fact, I still believe that if the trade war with China can be resolved and the bulk of tariffs lifted, we might finally see the free market back in action and a real boom cycle take hold – something that most millennials have never fully experienced as adults, although they witnessed the impact on their parents of the dot.com bust, the Great Recession (Financial Crisis), and the growing wealth gap, which perhaps is why so many of them have rejected capitalism and instead embraced socialist principles.
All of this has been bad enough on its own, but from an investor’s standpoint, it changed the very essence of a diverse asset ecosystem. It killed off long volatility strategies and created correlation across asset classes. Winning investing was all about beta, mostly via passive strategies, as abundant liquidity and low volatility lifted all boats. S&P Global recently reported, “Over the 10-year period ending December 2017, 90% of mutual fund managers and 59% of institutional accounts underperformed the S&P 500 on a net-of-fees basis. For the S&P SmallCap 600, these figures climbed to 96% and 82%, respectively.” The dominance of capital flows into passive market-cap-weighted products also accentuated the extreme outperformance of Growth versus Value. No wonder investors fled to low-cost passive strategies – lower costs and better performance. But then 2018 shook things up.
And then there were the “algos.” As the Wall Street Journal discussed in a December 26 article (and as many knowledgeable insiders have warned about for years), “…roughly 85% of all trading is on autopilot—controlled by machines, models, or passive investing formulas, creating an unprecedented trading herd that moves in unison and is blazingly fast.” Automated trading (both accumulation driving prices up and distribution driving prices down) in quant hedge funds and high-frequency trading (HFT) accounts removed liquidity from the system (i.e., no bids), culminating in a retail investor panic. During all those years of QE with the Fed pumping liquidity into the financial system, those same algorithmic traders were frontrunning orders and accentuating the bullish sentiment while keeping volatility low. Now, those same algo traders are doing the same thing to the downside, i.e., accentuating bearish sentiment and keeping volatility high – even though fundamentals are still sound. As quoted in the WSJ article, Scott Minerd of Guggenheim Partners opined that Fed monetary policy was “…fundamentally designed to encourage corporate America to lever up, which makes them more vulnerable to rising borrowing costs. The reversing of the process is actually more powerful.”
As a result, yes, a recession would be painful to stocks, but if the withdrawal of liquidity is done in a measured way, allowing fiscal stimulus to work its magic in supporting sustainable economic growth that gradually replaces the liquidity from Fed monetary stimulus, perhaps a recession can be pushed out to a later date, and a real boom cycle actually can take hold. In any case, as liquidity is gradually withdrawn and volatility remains elevated, skilled active stock selection could (should?) come back in vogue.
Forward valuations and outlook:
Looking ahead, the economy is growing, unemployment is historically low, consumer and business sentiment remain robust, corporate earnings in aggregate continue to come in strong (often with improved guidance), dividends are being increased, share buyback programs are at all-time highs, and corporate capital investment is growing at its fastest pace in 25 years. This is all suggestive of a risk-on market, but because investor sentiment suddenly turned defensive in the middle of 2018, equity valuations are essentially pricing in an imminent recession and 5% 10-year Treasury yields. Notably, corporate insiders have taken notice such that insider buying has been strong and reminiscent of August 2011 (when the S&P 500 was also approaching a -20% decline before staging a nice rally).
Today, forward P/E ratios are much more attractive than they were at the start of 2018, with the SPDR S&P 500 large cap ETF (SPY) and SPDR S&P 600 small caps (SLY) both around 14.5x and the SPDR S&P 400 mid caps (MDY) even lower at 13.8x. Moreover, certain cyclical market segments like VanEck Vectors Steel (SLX) have started this year at a meager 6.4x forward P/E, whereas defensive sectors like Utilities Select Sector SPDR (XLU) and Consumer Staples Select Sector SPDR (XLP) are at 16x and 17x, respectively. So, there is a lot of opportunity in the cyclicals – although Semiconductors are the notable exception to the trend of stable forward guidance, primarily due to inventory oversupply and Apple (AAPL) hitting a wall with international iPhone sales. However, looking ahead, chip demand is on firm footing given seemingly unstoppable high-tech drivers like robotics, AI, autonomous vehicles, IoT, and 5G.
Higher quality companies (rather than speculative growth) likely will be favored by skittish-but-hopeful bulls, which means a renewed focus on things like good free cash flow, strong balance sheets, and sustainable growth (the very things that Sabrient’s wholly-owned subsidiary Gradient Analytics is skilled at evaluating), which were largely ignored during the liquidity-driven, momentum-oriented bull market. Bonds still have historically low yields, and after taxes they yield less than the S&P 500, since dividends are taxed at a much lower rate than interest payments. And although we have plenty of problems here at home in the US, we tend to overlook what is happening overseas, which is much worse in my opinion. Just look at the political or economic turmoil in the UK, Germany, Italy, Japan, and China, much less the smaller emerging markets. US economic stability is the strongest in the world, which means global investor capital will continue to flow here into both stocks and bonds.
Ever since Sabrient published our first Baker’s Dozen top picks list 10 years ago, our GARP portfolios have experienced four major drawdowns – 1Q2009, mid-2011, 2H2015, and 2H2018 (the current one). In each of the first three instances, markets fell despite strong or improving fundamental outlook due to news headlines or macro uncertainties, and in retrospect, selling at each of those previous instances would have been the wrong thing to do, and this time seems no different to me. Indeed, we have seen glimpses of a renewed risk-on rotation whenever positive news has come out on one of those main macro bogeymen, as each time our portfolios gained back some ground against the benchmark. Our GARP model suggests that from a relative valuation standpoint, US cyclical sectors and small caps look quite attractive – and particularly if the Fed truly backs off its hawkish actions and if the trade standoff with China finally finds some measure of resolution, thus leading companies to restate guidance higher and enticing risk capital back into the market.
Wrapping up:
I believe the trade war with China has gone on too long and soon will be resolved in some way, simply because it is in the best interest of both parties to do so. China has seen its factories struggling as the trade war goes on, as its manufacturing purchasing managers index dropped to 49.4 in December, the weakest since early 2016 and below the 50 level indicating contraction. And as the yuan sold off in forex markets during 2018, its foreign exchange reserves declined by over $67 billion (to $3.073 trillion), versus a $129 billion increase in 2017. Formal trade talks were held in Beijing this week, with a cabinet-level follow-up meeting scheduled later in the month. And although the Fed is trying to assert its independence, recent comments suggest that rate hikes will slow in recognition that the US is not immune to the interdependent and heavily-indebted global economy and skittish securities markets. So, I am optimistic that the threat to stocks from those two bogeymen (China trade war and Fed policy) will diminish early in 2019, which leaves us with the highly uncertain – but longer-term – issue of the impacts of gradually deleveraging a massively leveraged global economy in the face of a global populist movement (spawned by the very monetary policies that “saved” the global economy from calamity in the first place) that rejects austerity.
Again, I think we have been presented with a great buying opportunity, with perhaps 20-25% upside in the S&P 500 index during 2019, which would finally put the index above the 3,000 mark. The US economy is strong, with no imminent signs of recession, and corporate earnings forecasts are solidly positive (and certain market segments and leading companies will do much better than the broad averages). Cash balances among money managers are high. Dividend-paying stocks are looking quite good relative to bonds, especially those with earnings growth potential and a history of raising their dividends. Corporations are still flush with cash and will continue to generate more given the biggest tax overhaul in a generation, which, along with broad deregulation, has incentivized capital investment (for business expansion, domestic relocation and reverse tax inversions, upgrading of factories, equipment, and technology, hiring, and production), increased dividends, continued share buybacks (already at record levels, which lowers P/E ratios), and M&A. Inflation and interest rates remain low. Corporate insiders are buying at the highest rate in years. Technological breakthroughs continue to disrupt and revolutionize the economy and are largely disinflationary as they boost efficiency and productivity. And although the selloff in the mega-cap Tech juggernauts has spooked a lot of investors, it may reflect the start of a healthy rotation and broadening from the mega-cap darlings and the Growth and Momentum factors into small caps and the Value and Quality factors. From a global perspective, I think investors will prefer the US for its safety, stability, innovation, productivity, and work ethic. In addition, I think the bearish investor sentiment has set up a contrarian buying opportunity, particularly as short-covering adds fuel to a resurgence in bullish conviction, and perhaps those hated cyclical sectors will be the leaders in 2019.
SPY Chart Review:
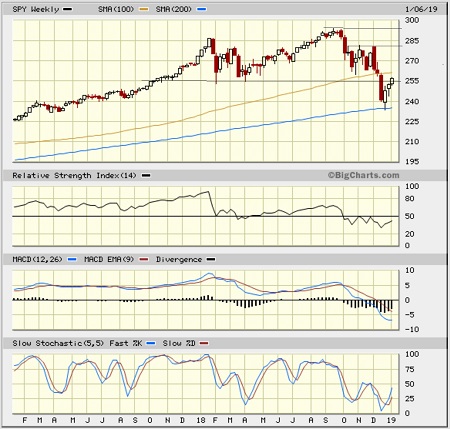
The SPDR S&P 500 ETF (SPY) closed Wednesday (1/9) just below 258. My last article in early December observed that the SPY was either pounding out a triple bottom from which to launch a year-end recovery rally, or it was getting ready to break down through important support and form a “death cross” (the 50-day simple moving average crossing down through the 200-day SMA). As you know, it turned out to be the latter, as the market took a swan dive the week before Christmas straight through Christmas Eve Monday. But in retrospect, it was something of “final capitulation,” exacerbated by tax-loss selling. I am showing a slightly different chart this time in that it uses weekly data points rather than daily, as this appears to better show where support finally arrived, namely the 200-week moving average (near the 235 price level), where a strong bounce occurred. Note that the oscillators RSI, MACD, and Slow Stochastics on the weekly chart all indicate the early stages of a climb out of extremely oversold territory, with quite a bit more upside potential.
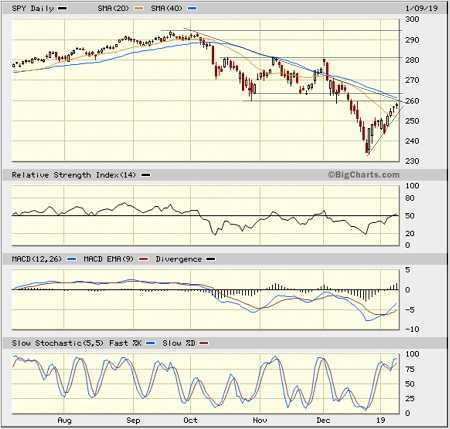
On the other hand, the daily chart below shows that price has come a long way in a short time, recapturing the 20-day SMA and now challenging the 50-day SMA near 263. However, it is still well below the 200-day SMA up around 274, while oscillators will soon need to take a breather and cycle back down. Overhead resistance sits at 260, and the convergence of the short-term uptrend line with the multi-month downtrend line is right around the same spot. The technical picture is looking much better, as investor sentiment improves given the strong technical bounce, passage of tax-loss selling season, and positive messages regarding the trade war and Fed policy.
Latest Sector Rankings:
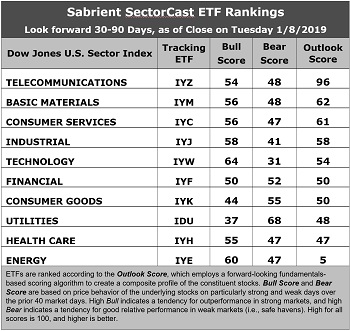
Relative sector rankings are based on our proprietary SectorCast model, which builds a composite profile of each of over 600 equity ETFs based on bottom-up aggregate scoring of the constituent stocks. The Outlook Score employs a forward-looking, fundamentals-based multifactor algorithm considering forward valuation, historical and projected earnings growth, the dynamics of Wall Street analysts’ consensus earnings estimates and recent revisions (up or down), quality and sustainability of reported earnings, and various return ratios. It helps us predict relative performance over the next 2-6 months.
In addition, SectorCast computes a Bull Score and Bear Score for each ETF based on recent price behavior of the constituent stocks on particularly strong and weak market days. A high Bull score I ndicates that stocks within the ETF recently have tended toward relative outperformance when the market is strong, while a high Bear score indicates that stocks within the ETF have tended to hold up relatively well (i.e., safe havens) when the market is weak.
Outlook score is forward-looking while Bull and Bear are backward-looking. As a group, these three scores can be helpful for positioning a portfolio for a given set of anticipated market conditions. Of course, each ETF holds a unique portfolio of stocks and position weights, so the sectors represented will score differently depending upon which set of ETFs is used. We use the iShares that represent the ten major U.S. business sectors: Financial (IYF), Technology (IYW), Industrial (IYJ), Healthcare (IYH), Consumer Goods (IYK), Consumer Services (IYC), Energy (IYE), Basic Materials (IYM), Telecommunications (IYZ), and Utilities (IDU). Whereas the Select Sector SPDRs only contain stocks from the S&P 500 large cap index, I prefer the iShares for their larger universe and broader diversity.
Here are some of my observations on this week’s scores:
1. Telecom continues to hold the top spot with a strong Outlook score of 96. Telecom displays an attractive forward P/E of 13.4x, the highest return ratios, and stable sell-side analyst sentiment (net revisions to EPS estimates). However, its pure GARP metrics are only average, with projected year-over-year EPS growth rate of only 8.7% and a forward PEG (ratio of forward P/E to forward EPS growth rate) of 1.54, which ranks it only 8th out of 10 sectors on PEG (this is why we don’t see many Telecoms as candidates for Sabrient’s GARP portfolios, which have a 12-24 month outlook rather than 3-6 months). Basic Materials again takes second with an Outlook score of 62, as it displays an attractive forward P/E of 13.1x and a low forward PEG of 1.09. Consumer Services (Discretionary/Cyclical) has moved into third and currently displays the stable sell-side analyst sentiment, reasonable return ratios, and the best insider sentiment (open market buying). Industrial, Technology, and Financial round out the top six.
2. At the bottom of the rankings we again find Energy and Healthcare. Energy continues to get hit with downward earnings revisions (as oil prices have remained relatively low), and its return ratios are weak, although it also displays the strongest projected EPS growth rate of 44% and the lowest forward PEG of 0.40. Healthcare displays an elevated forward P/E (16.3x) and poor return ratios.
3. Looking at the Bull scores, Technology enjoys the top score of 64, followed by Energy at 60, as stocks within these sectors have displayed relative strength on strong market days. Utilities scores the lowest at 37, followed by Consumer Goods (Staples/Noncyclicals) at 44 – both are defensive sectors. The top-bottom spread is wide at 27 points, which reflects low sector correlations on strong market days. It is desirable in a healthy market to see low correlations reflected in a top-bottom spread of at least 20 points, which indicates that investors have clear preferences in the market segments and stocks they want to hold (rather than broad risk-on behavior).
4. Looking at the Bear scores, as usual, we find defensive sector Utilities alone in the top spot with a score of 68, followed by Consumer Goods (Staples/Noncyclical) at 55, which means that stocks within these defensive sectors have been the preferred safe havens lately on weak market days. Technology has by far the lowest score of 31, as investors have fled during recent market weakness, largely due to a massive repricing among the mega-cap Tech names late in the year. The top-bottom spread is 37 points, which reflects quite low sector correlations on weak market days. Ideally, certain sectors will hold up relatively well while others are selling off (rather than broad risk-off behavior), so it is desirable in a healthy market to see low correlations reflected in a top-bottom spread of at least 20 points.
5. Telecom displays the best all-around combination of Outlook/Bull/Bear scores, followed by Materials, while Energy is the worst. Looking at just the Bull/Bear combination, Energy is the best, indicating superior relative performance (on average) in extreme market conditions (whether bullish or bearish), while Technology scores the worst.
6. This week’s fundamentals-based Outlook rankings still reflect a bullish bias, given that five of the top six sectors are economically-sensitive or cyclical, and all of them score above 50. It remains a bit concerning that Telecom has remained at the top when in fact I expected it to be a temporary phenomenon. Keep in mind, the Outlook Rank does not include timing, momentum, or relative strength factors, but rather reflects the consensus fundamental expectations at a given point in time for individual stocks, aggregated by sector.
ETF Trading Ideas:
Our Sector Rotation model, which appropriately weights Outlook, Bull, and Bear scores in accordance with the overall market’s prevailing trend (bullish, neutral, or defensive), continues to display a defensive bias and suggests holding traditionally defensive Utilities (IDU), Telecom (IYZ), and Consumer Goods (Staples/Noncyclical) (IYK), in that order. (Note: In this model, we consider the bias to be defensive from a rules-based trend-following standpoint when SPY moves below both its 50-day and 200-day simple moving averages.)
Besides iShares’ IDU, IYZ, and IYK, other highly-ranked ETFs in our SectorCast model (which scores nearly 500 US-listed equity ETFs) from the Utilities, Telecom, and Consumer Goods sectors include First Trust Utilities AlphaDEX Fund (FXU), iShares Global Communication Services (IXP), and First Trust Consumer Staples AlphaDEX Fund (FXG).
If you prefer a bullish bias (which might be warranted by the extremely oversold conditions and still-solid fundamentals), the Sector Rotation model suggests holding Technology, Telecom, and Industrial, in that order. On the other hand, if you are more comfortable with a neutral stance on the market, the model suggests holding Telecom, Basic Materials, and Consumer Services (Discretionary/Cyclical), in that order.
An assortment of other interesting ETFs that are scoring well in our latest rankings include US Global Jets (JETS), VanEck Vectors Mortgage REIT Income (MORT), Global X SuperDividend US (DIV), First Trust NASDAQ Bank (FTXO), VanEck Vectors High Income MLP (YMLP), SPDR S&P Bank (KBE), ProShares Ultra NASDAQ Biotechnology (BIB), Alpha Architect US Quantitative Value (QVAL), SPDR S&P Pharmaceuticals (XPH), FLAG-Forensic Accounting Long-Short (FLAG), and VictoryShares US Small Cap High-Div Vol-Weighted Index (CSB).
Disclaimer: This newsletter is published solely for informational purposes and is not to be construed as advice or a recommendation to specific individuals. Individuals should take into account ...
more

