
Investor Optimism Giddy Going Into 4Q19 Earnings Season
Elevated multiples have not bothered equity bulls. In recent months, the Fed too has come to their aid. Investor optimism is dangerously elevated going into the 4Q19 earnings season.
The 4Q19 earnings season kicks off this week. Banks and brokers will dominate, with Citi Group, JP Morgan and Wells Fargo reporting on Tuesday, Bank of America and Goldman Sachs on Wednesday and Morgan Stanley on Thursday.(They all report before the market opens.)
As of December 31, the sell-side was expecting $40.19 in operating earnings from S&P 500 companies in the last quarter of last year. When the quarter started, these analysts were expecting $42.17.As a matter of fact, in August 2018 they expected $47.14.So, expectations have been lowered quite a bit, which should make companies’ job of meeting/beating them easier.
The downward trend in earnings estimates is not just for 4Q. For the year as a whole, S&P 500 companies in August 2018 were expected to ring up $177.13, versus $158.14 now. For next year, $186.36 was expected in March last year, which has now been cut down to $175.52.
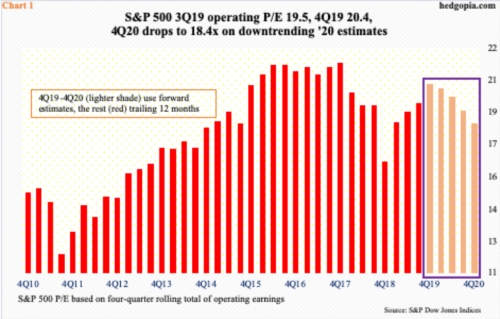
Lower earnings – trailing or forward – combined with higher prices obviously puts upward pressure on valuations. On a trailing 12-month basis, the S&P 500 traded at a P/E multiple of 19.5x at the end of 3Q (Chart 1). Already elevated, this further rose to 20.4x in 4Q, although the denominator could change as companies begin reporting. Using this year’s estimates, the multiple drops to 18.4x, but given the revision trend, it is anyone’s guess if these estimates can be taken at face value.
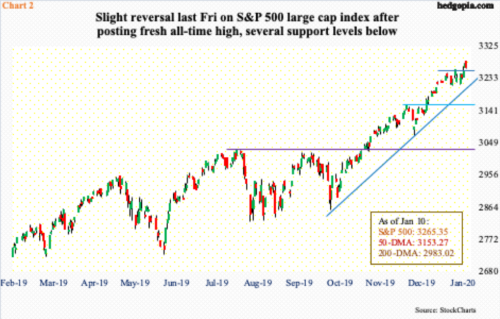
Right now, extended valuations are not something equity bulls seem worried about. They rallied the S&P 500 (3265.35) nearly 29 percent last year. With seven sessions in, the index is up another 1.1 percent this year, and was up as much as 1.6 percent at Friday’s all-time high of 3282.99 (Chart 2).Bulls carry the momentum ball.
Bears had several opportunities early last week and the week before that to reclaim the 10-day moving average (3246.13), but bulls held their ground. That said, bears may have some opening near term, as Friday’s small reversal took place right at the daily upper Bollinger band. At 67.7, the daily RSI has dropped back below 70. The weekly RSI is at 75.6. Momentum begets momentum, as the saying goes.Until it is broken, that is. From the lows of early October through Friday’s high, the S&P 500 rallied 15 percent!
In the event that bears succeed in pressing the small opening, they have been accorded wider, nearest support lies at 3260, followed by trend-line support from early October at 3210. Should this be tested, the 10- and 20-day would have been lost.
Even under this scenario, until stocks take a serious hit, it will be a while before the elevated territory several metrics are in gets unwound – or begin to get unwound.
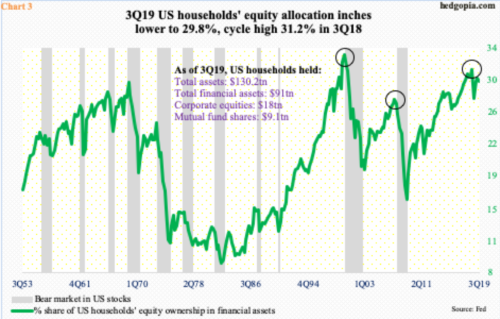
Chart 3 presents one such metric, which simply shows US households’ equity allocation. As of 3Q19, households’ equity ownership in financial assets stood at 29.8 percent, down four-tenths of a percentage point sequentially. The cycle high 31.2 percent was recorded in 3Q18. It is probable, once 4Q19 numbers are reported, we find out the metric increased nicely in that quarter. The S&P 500 jumped 8.5 percent in 4Q.
The current reading is already past the 2Q07 high of 27.7 percent but behind the record high of 32.9 percent in 1Q00. We know how those two peaks ended.
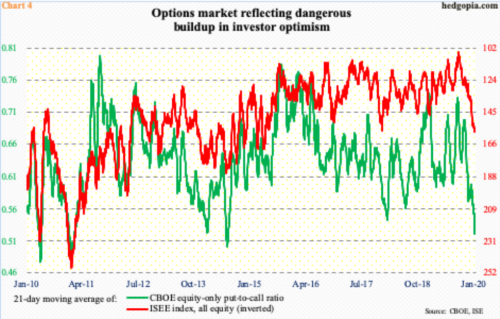
Both Charts 1 and 3 can have long-term repercussions. Once a process of unwinding begins in earnest, stocks are bound to enter correction territory – even a bear market, as was the case in the prior two bear markets. Near term, Chart 4 is a potential catalyst.
In the options market currently, the CBOE equity-only put-to-call ratio and the ISEE index reflect excessive optimism. The latter is a call-to-put ratio, hence inverted in the chart. It excludes trades from market makers and brokers/dealers, and only uses opening long trades. Market makers need to hedge exposure all the time. Retail traders, on the other hand, bet on the direction. Many consider the ISEE reading cleaner of the two.
Last week, the 21-day moving average of the CBOE put-to-call ratio ended at 0.521 and the ISEE index at 157.1, with the latter having risen to 157.8 on Tuesday, which was the highest since May 2015. The CBOE reading was the lowest since July 2014. These are very elevated readings. The sentiment is way too optimistic.
One advantage – if it can be viewed this way – of this elevated investor sentiment is that it then tends to get reflected in how consumers feel and consume.
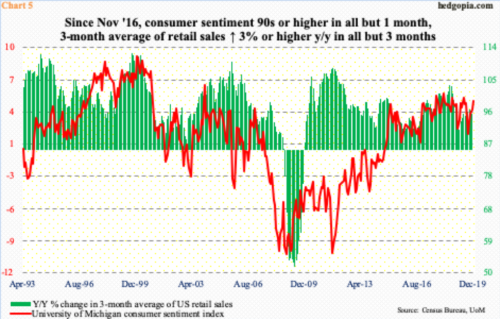
In December, the University of Michigan’s consumer sentiment index increased 2.5 points month-over-month to 99.3. Except for last August’s 89.8, sentiment has remained above 90 since November 2016, four of which were 100 or higher.
In the meantime, retail sales are hanging in there. In the 12 months to November, sales rose 3.4 percent to a seasonally adjusted annual rate of $528 billion – a record. The three-month average of sales increased by the same amount; other than the first three months last year, this metric has grown with at least a three handle since November 2016 (Chart 5).
As things stand, elevated stock prices got to be helping consumer confidence and consumption. The latest source of tailwind has come from the Fed.
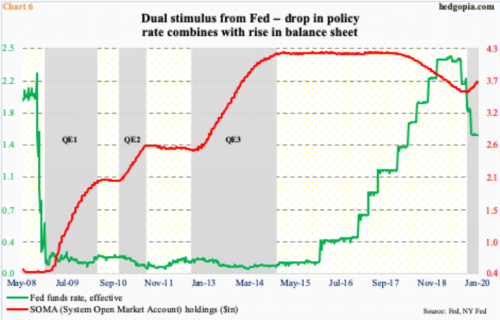
0Since late September, the Fed has been expanding its balance sheet.SOMA (System Open Market Account) holdings went from $3.55 trillion to $3.73 trillion – up $180.3 billion (Chart 6). The bank continues to cut its mortgage-backed securities but have been accumulating Treasury notes and bonds and most prominently Treasury bills. The latter has gone from $6 billion in late September to $184.5 billion.
Prior to the recent build-up, the Fed had been reducing its bloated balance sheet, with SOMA holdings peaking at $4.24 trillion in April 2017. Arguably, what is going on in the past three months can be described as stealth QE. This comes in the wake of three rate cuts in 25-basis-point increments last year, to a range of 150 to 175 basis points. Markets love liquidity.
In July through September, there were two minor sell-offs in US stocks. Coincidence or not, the bottom early October pretty much coincided with the bottom in SOMA holdings. The rally since that low has been relentless and non-stop, with some help from shorts.
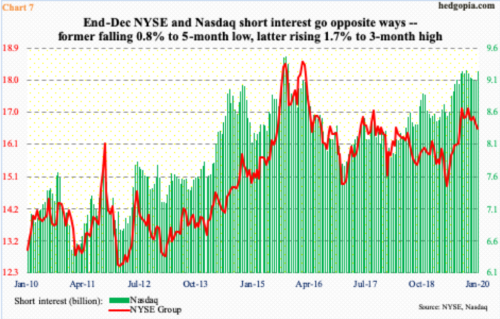
As of end-December, NYSE short interest was at a five-month low.Mid-December, Nasdaq short interest was at a four-and-a-half-month low, but it shot up 1.7 percent in the subsequent period to rise to a three-month high (Chart 7).
Either way, short interest remains elevated. It is easy to understand the shorts’ zeal to get aggressive. Earnings growth is subdued and multiples high, among others. But until Charts 1 and 3 begin to unwind in earnest, they just become a squeeze vehicle for bulls.
Immediately ahead, the one to watch is Chart 3.Investor optimism is too giddy not to begin unwinding. The advantage bulls have is the lowered 4Q19 earnings bar and shorts who are likely to cover at support.


