
Investor Focal Points To Start 2021
Welcome to another trading week!! In appreciation of all of our daily readers of finomgroup.com content, we offer the following excerpts from our Weekly Research Report. Our weekly report is extremely detailed and has proven to help guide investors and traders during all types of market conditions with thoughtful insights and analysis, graphs, studies, and historical data/analogues.
Research Report Insight #1
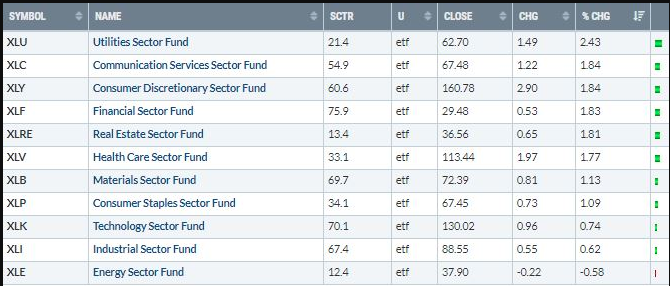
For the week that was, the best performing sectors proved a mixed bag, but largely with a defensive slant. Utilities (XLK) led the way with a 2.43% weekly gain, while Consumer Discretionary (XLY) still managed to carry its momentum into year-end.
In our December 13, 2020, Research Report, I discussed the Utilities sector ETF relative performance, suggesting there may prove some further outperformance when compared to the S&P 500 near-term. Ideally, this isn’t really what we want to happen, but for the sake of identifying some probable market rotations during an increasingly overbought market trend, it’s always useful to maintain appropriate market expectations.
Here is what I offered previously:
“The reality is that Utilities have been relatively weak for quite some time. This past week’s outperformance may have legs near-term, if not into year-end.
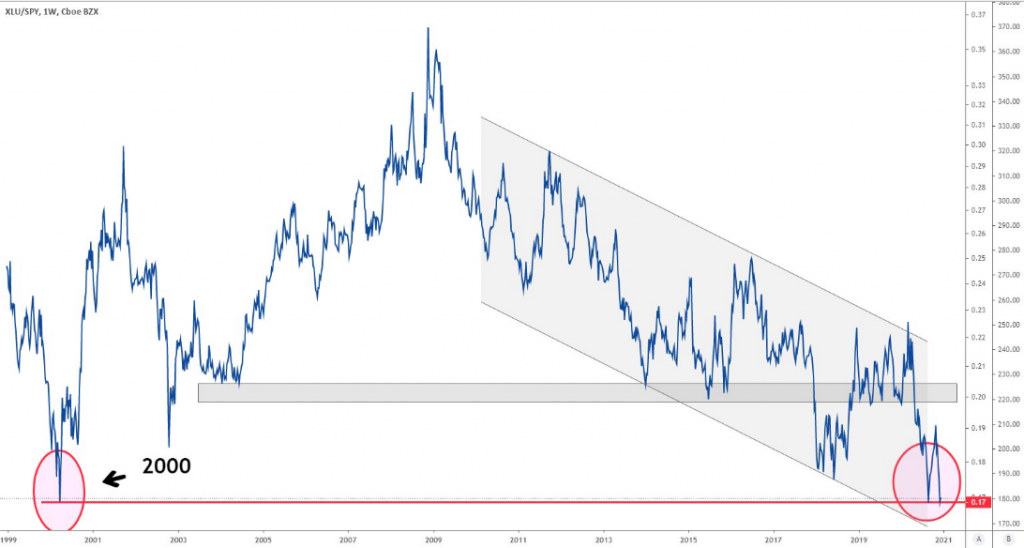
The Utilities/S&P 500 ratio is bouncing at 20-year support levels for the second time this year. The long-term relative performance is nothing worthy of admiration, clearly, but if you’re looking for a “rental ETF” this may fit the bill. Remember, everyone hated Energy and Financials, until they didn’t.
Research Report Insight #2
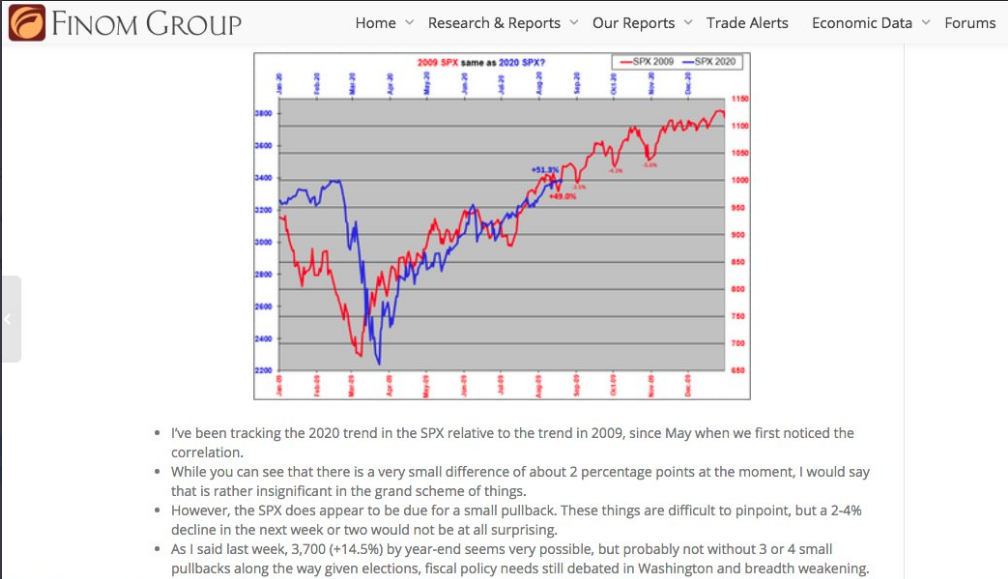
Recall my touting of the 2020 markets’ potential rebound, given the likeness off of the 2009 March lows (tweet/chart above). I identified the potential rebound as early as May 2020 and promoted, followed, and updated the 2009 analogue for members since May. As I continued with the likeness through August 2020, I also recognized that if the full extent of the 2009-analog was to play out in 2020, the S&P 500 would achieve 3,761 by year-end. I don’t think I need to say anything further with respect to knowing your market history. I don’t think I need to encourage investors further with respect to always maintaining an optimistic outlook on markets, but rather extending one’s time frames for returns when drawdowns arrive. I don’t think I need to restate that bear markets typically provide investor education, and should be engaged for that educational value at least. So without thinking any further, I’ll simply say that history has proven a useful tool for investors, once again, and bear markets are typically like Amazon “flash sales”; they should be viewed for the value they deliver!
Research Report Insight #3
With the aforementioned in mind, I will offer this: The last time we witnessed a similar yearly candlestick end like that of December 31, 2020, while still in an uptrend, was in 1982.
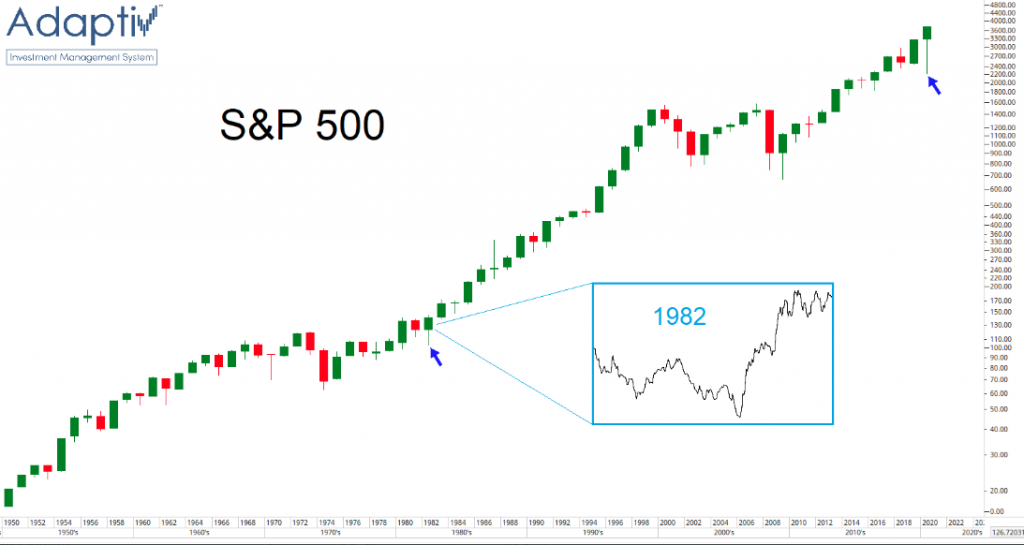
Equity market returns proved quite strong in the years that followed 1982. So if we forgo “short-termism” i.e. January-February 2021, and focus on 2021 as a whole, the market should produce a good return-environment for investors/traders. History is not a guarantee of future returns, but it helps us to assess the probabilities. If the probabilities don’t play out according to all the many forms of historic data we study week-in-and-week-out, there is not much more an investor can ask of himself/herself. That is just the way the ball bounces, even if ever so infrequently.
Research Report Insight #4
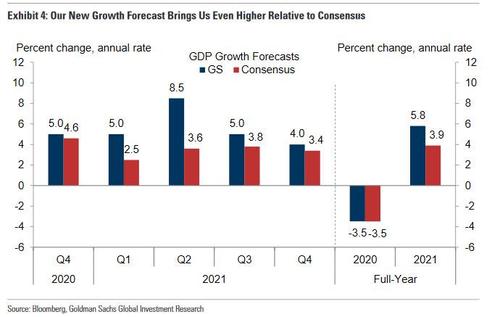
Not every major firm analyzes the economic outlook, post a second relief package, the same way. Nonetheless, we may see additional revised outlook from other firms in early 2021. For now, we aim to compare the consensus analysts’ estimates with Goldman’s, and showing that Goldman’s forecast for 2021Q1 growth is now meaningfully above consensus expectations of +2.5 percent. For what it’s worth, J.P. Morgan’s team also hiked its GDP estimate to 0.5% from a -0.1% contraction in the Q1 2021 which isn’t yet reflected in the chart below.
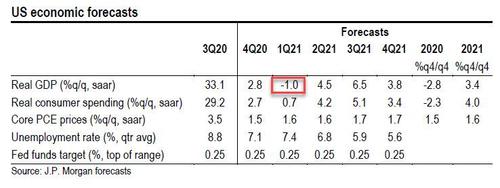
Goldman expects substantially faster sequential growth than consensus in 2021Q2–Q4. As a result, Goldman’s GDP forecast for 2021 as a whole is now 1.9% above consensus on a full-year basis (+5.8% vs. +3.9%) and 2.1pp above consensus on a Q4/Q4 basis (+5.6%vs. +3.5%).
I’m of the opinion that Goldman Sachs is closer to the probable GDP growth that we could see in 2021 than other firms. I'm also of the opinion that most GDP models will prove cumbersome given the unique circumstances attached to the current recovery cycle. There is very little history to draw upon with respect to a pandemic, self-induced economic recession that quickly reverses on the heels of fiscal and monetary policy implementation and to the degree which has never taken place in the past. As such, Finom Group (for who I am employed) recently offered its outlook for 2021 as follows:
“With that said, the official price target established for the 2021 S&P 500, from Finom Group, is 4,325. We have modeled for $182 in 2021 EPS, above the consensus analysts’ estimate, as we believe the street has not fully discounted that which they’ve not seen before, including how global trade partners might respond to a more amicable U.S. Administration after 4 years of de-globalization efforts. We also believe, barring an exogenous global event, Finom Group’s above consensus estimate may prove too low should the tailwinds from a Service sector rebound build momentum in the back half of the year that produces nirvana-like economic conditions.“
Research Report Insight #5
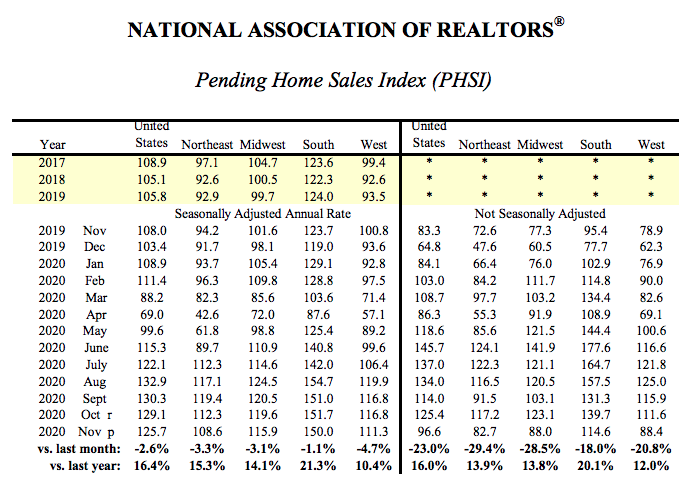
- Pending home sales slightly decreased by 2.6% in November from the prior month, the third consecutive month of decline. All regions experienced month-over-month declines.
- Nationally, contract signings jumped 16.4% from one year ago with all regions reaching double-digit year-over-year increases.
- The Pending Home Sales Index hit 125.7, an all-time high for November.
With record low housing inventory, we anticipate any weakness in the MoM data to be attributed to low inventory levels and/or regional economic restrictions due to Covid-19. Otherwise, Housing Starts and Building Permits data, combined with record-low mortgage rates are supportive of a continued housing sector uptrend into 2021.
In previously speaking to the mortgage forbearance issues, the latest McDash Flash Forbearance Tracker found that forbearance plan volumes ticked upwards for the third week in a row, rising by 15,000 from the prior week and pushing the number of active plans to its highest level since early November.
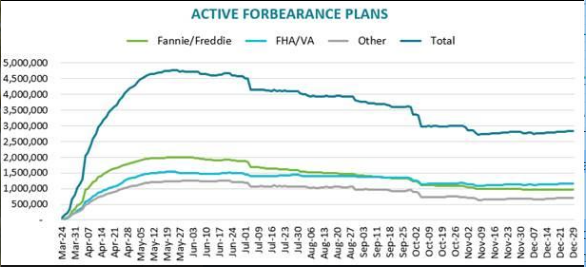
This week’s increase was primarily the result of limited forbearance plan removal activity, with removals falling to their lowest level since the start of the pandemic, likely due (at least in part) to the holiday week. On a bright note, forbearance plan starts also hit their lowest level since the pandemic began, a number also likely impacted by the holidays. Forbearance start volumes have now fallen in each of the last three weeks running.
Despite 3 consecutive weekly rises, the number of active plans only stands 13,000 higher than the same point last month, and with nearly 270,000 forbearance plans still set to expire at the end of December, it’s possible that we could see an inflow of forbearance plan removals over the first week of January, a situation Black Knight experts will continue to monitor. s of Dec. 29, some 2.83 million (5.3% of) homeowners remain in COVID-19-related forbearance plans.
Research Report Insight #6
Previously, FactSet was forecasting an earnings decline of just over -10% for the Q4 period. As of December 18th, however, FactSet shows an earnings forecast of a -9.7% decline.
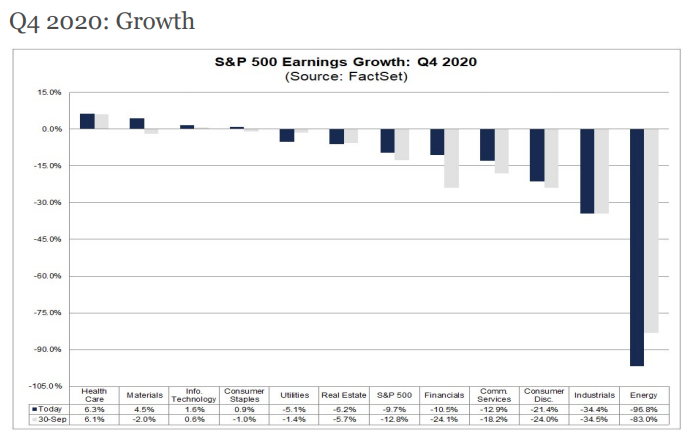
- For CY 2020, analysts are projecting an earnings decline of -13.6% and a revenue decline of -1.8%.
- For Q1 2021, analysts are projecting earnings growth of 15.6% and revenue growth of 3.6%.
- For Q2 2021, analysts are projecting earnings growth of 45.0% and revenue growth of 13.7%.
- For CY 2021, analysts are projecting earnings growth of 22.1% and revenue growth of 7.9%.
Research Report Insight #7
While there are certainly parallels to the past, every time is different and 2020 has been the embodiment of that principle.
- During the 2008 recession, we saw a larger earnings collapse (-40%), but stocks fell 38.5%, meaning multiples only expanded slightly (from 17.8 to 18.2).
- During the 2001 recession, earnings also fell more than this year (-30.8%). But again, stocks declined 13% in 2001, meaning a smaller multiple expansion (23.5 to 29.6).
The difference in 2020 has been that while earnings have declined 23%, stock prices have risen 13 percent. We saw something similar to that in 1991 at the end of the 1990-91 recession, where earnings declined 14.8% while stocks rose 26.3 percent. In 1991, however, P/E ratios expanded from 14.6x to 21.6x. This year they have moved from 20.6x to 30.3x. (Charlie Bilello)
The reality is that P/E ratios do, indeed, expand over time; we just haven’t seen such levels of expansion so rapidly. To wit; we’ve never had such significant, rapid fiscal and monetary policy collide with a self-induced recession either.
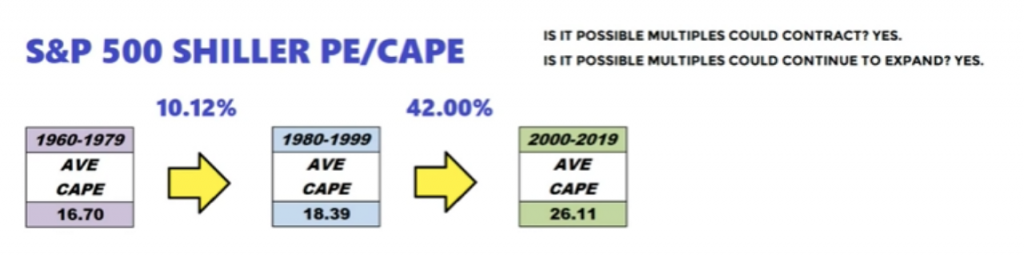
It’s extremely difficult to ask investors/strategists/analysts to use the average P/E ratio over the past decade to reflect the probabilities for valuations going forward given such unprecedented circumstances. Moreover, the free cash flow levels, low-interest rates, and monetary policy continue to push investors toward risk assets, providing the potential for P/E expansion sustainability. (graphic from Chris Ciovacco)
Research Report Insight #8
I will continue to track how well the 2021 path of the SPX (orange line) follows the path of the SPX in 2010 (green line). It is worth watching given how closely correlated 2009 & 2020 were. No one knows if it will continue into 2021, but if it does, it may imply a potential pullback of about -5% in the latter part of January and before lifting higher once again.

The potential drawdown mentioned does not align with much of the data we have covered in recent weeks, but this is also why we remain flexible and open to a wide variety of outcomes.
The current bull market, which began on 3/23, is now 283 days old and as of the last high record high (12/31), the S&P 500 was +67.5 percent. It is still the shortest bull market by far, but its strength has already surpassed 2 others. (Data/chart Charles Schwab)

Research Report Insight #9
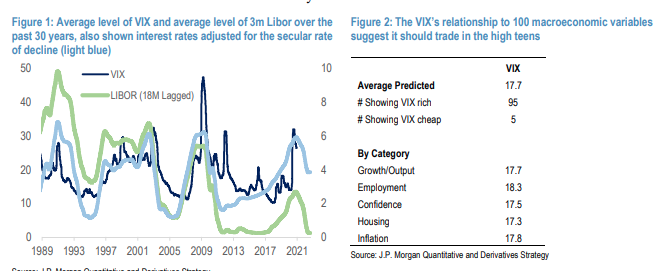
J.P. Morgan’s Marko Kolanovic discusses his outlook for 2021, which also highlights volatility’s impact on the S&P 500 as follows:
The figure below shows that average VIX levels closely follow levels of interest rates with an ~18-month lag. Given the significant increase of monetary accommodation 9 months ago, we expect it to pressure volatility for most of 2021. Volatility also correlates with various macroeconomic variables related to economic growth, employment, housing, consumer confidence, etc. We analyzed ~100 of these relationships and found that most of them (95 out of 100) indicate the VIX should be lower, averaging 17.7 (Figure 2).
“A decline in volatility creates a positive feedback loop, where systematic and discretionary hedge fund strategies increase allocation to equities. This process may take most of 2021 to play out, as the economic recovery as well as inflows in the risky strategies are likely to be gradual. For instance, if strategies’ exposure goes from current below average levels (CTAs ~40th %tile, VT & RP ~15th %tile, Hedge Funds ~25th %tile ) to ~65th historical percentile, this would result in ~$250bn inflows for systematic funds and ~$300bn inflows for Hedge Funds.
Disclaimer: The risk of loss in stock, stock/options, futures, futures/options, and forex trading is substantial, and site visitors and subscribers should consider whether trading these markets ...
more

