
Interpreting Inflation Rates For May
May CPI inflation surprised on the upside, with month-on-month 0.6% vs 0.4% (not annualized) Bloomberg consensus, year-on-year 5% vs 4.7%. Note that May’s 0.6% month-on-month is below April’s 0.8%, highlighting the decline in high-frequency inflation. We have the following readings on inflation (month-on-month):
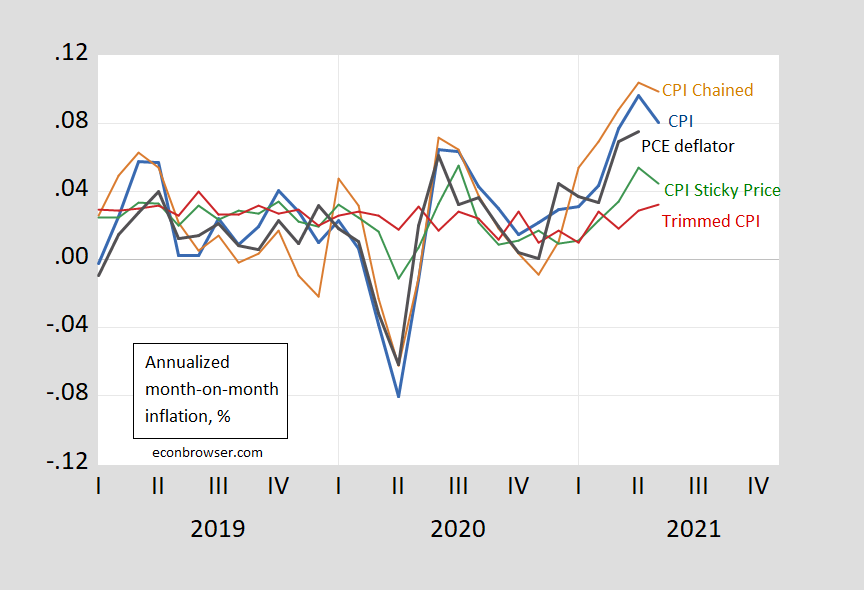
Figure 1: Month-on-month annualized inflation from CPI-all urban (blue), from personal consumption expenditure (PCE) deflator (black), chained CPI (brown), sticky price CPI (green), and 16% trimmed mean CPI (red). Source: BLS, Atlanta Fed, Cleveland Fed, via FRED, and author’s calculations.
Note that month-on-month inflation is down using chained CPI, as well as the sticky price CPI. The latter should represent inflation expectations better. The trimmed CPI — which takes out outliers in component inflation — did rise from 2.9% to 3.2%, so there are clearly some upward price pressures remaining.
If one calculates the longer horizon inflation rates, one can see the base effect. Annual CPI inflation is 5%, while 15-month (annualized) inflation is only 3%
Finally, the base effect shows up to the extent that the actual price level in May is less than one percentage point above the 2016-19 (log) trend, despite the rapid inflation in the last two month’s of data.
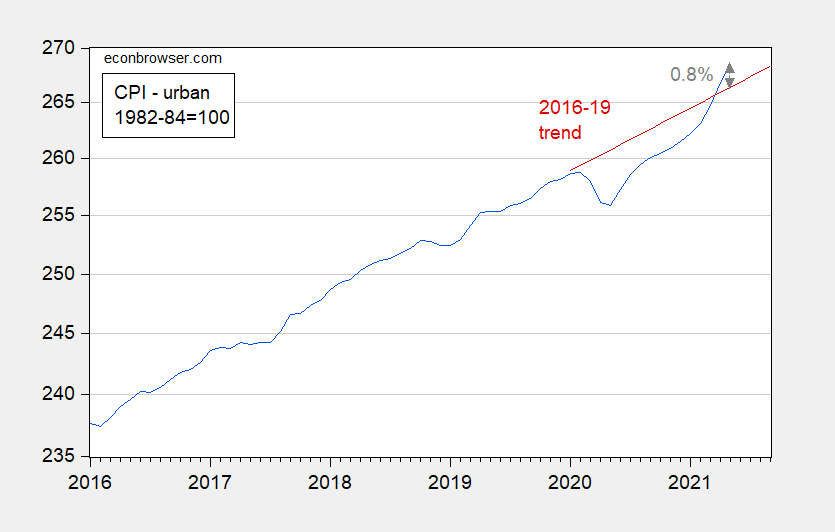
Figure 2: CPI (blue) and 2016-19 trend (red). Source: BLS, and author’s calculations.
The market’s 10-year breakeven rate barely budged in the wake of the release and remains near lows 0f 2.35% (and keep in mind, the breakevens are probably overestimates of actual inflation estimates by the market, as discussed here). The long-term expected inflation is key to thinking about prospects for sustained inflation (see here for a discussion of inflation in the context of the Phillips curve).
Disclosure: None.


