Inside Friday’s Bank Earnings, The Age Of Magic Money And 3,749
4Q Earnings Season kicked off for real on Friday with JP Morgan (JPM), Citigroup (C) and Wells Fargo (WFC) reporting. The WSJ’s ace banks reporter, Telis Demos, had a great piece explaining the dynamics of bank balance sheets, “Banks Are Not Ready to Show You The Money”, January 16. While deposits are growing quickly, banks are having difficulty growing their loan books. For example, JPM’s deposits grew by 37% year over year but their loan book by only 2%. C saw deposits +19% while their loan book was actually -4%.
As a result, banks are having to invest their new assets in investment securities rather than traditional loans: “While banks don’t have great options for deploying cash without loan growth, the banks mostly increased their investment-securities assets in the fourth quarter… This helped slow their quarterly declines in net interest margin, a measure of banks core profitability” (Demos).
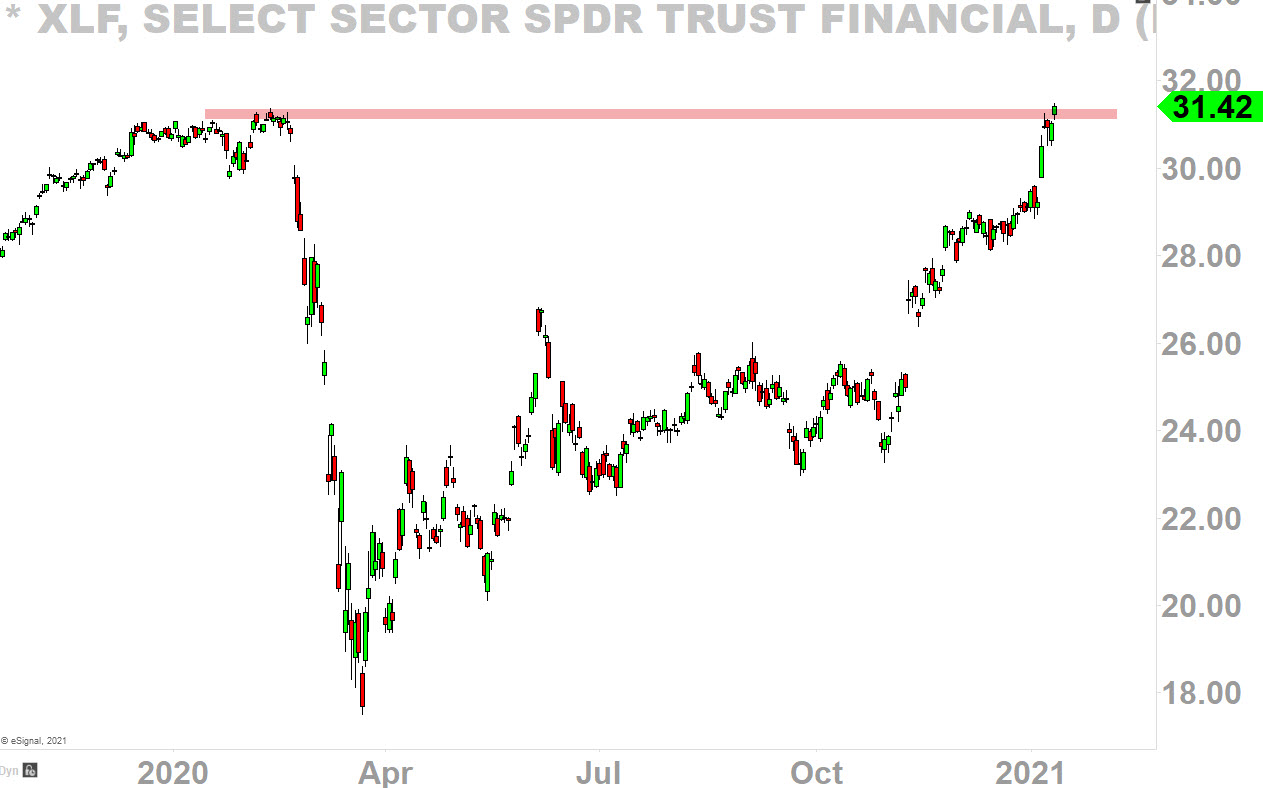
Whatever the reason, all three banks got hit on Friday with JPM -1.79%, WFC -7.80% and C -6.93% causing the XLF to be -1.65% to $30.94 and fail, for now, at the previous bull market highs (Chart Source: 2kaykim Twitter, January 12, 9:52am).
I was reading Jim Rickard’s excellent new book The New Great Depression yesterday which led me to Sebastian Mallaby’s “The Age of Magic Money: Can Endless Spending Prevent Economic Calamity?” (Foreign Affairs, July/August 2020).

When it comes to lending, we are not going to run out of ammunition – Fed Chair Powell quoted in Mallaby
Mallaby shows how the Fed has become Uber aggressive in response to the coronavirus as has the Federal Government. The combination of all this quantitative easing and federal stimulus has levitated financial markets and kept the economy from complete collapse.
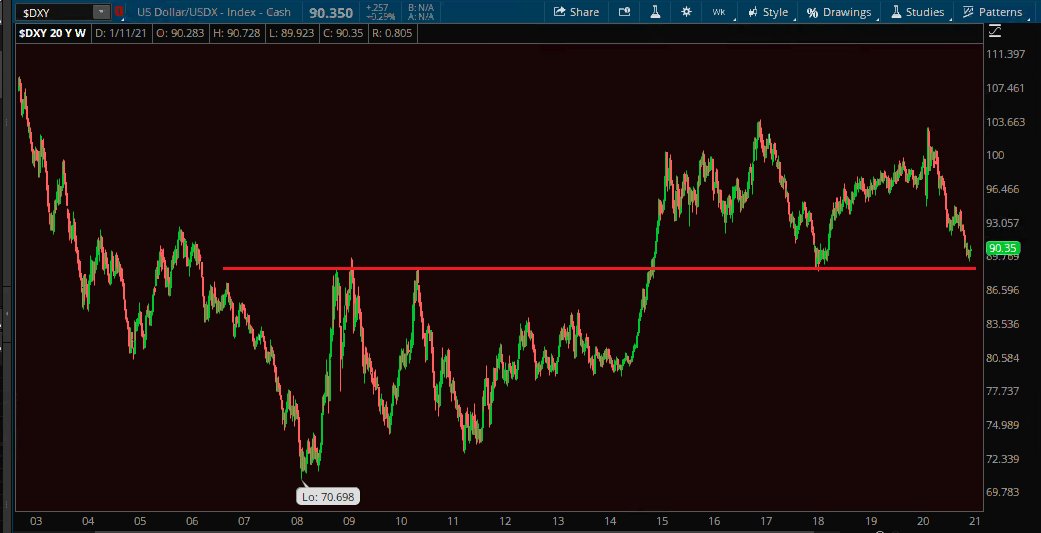
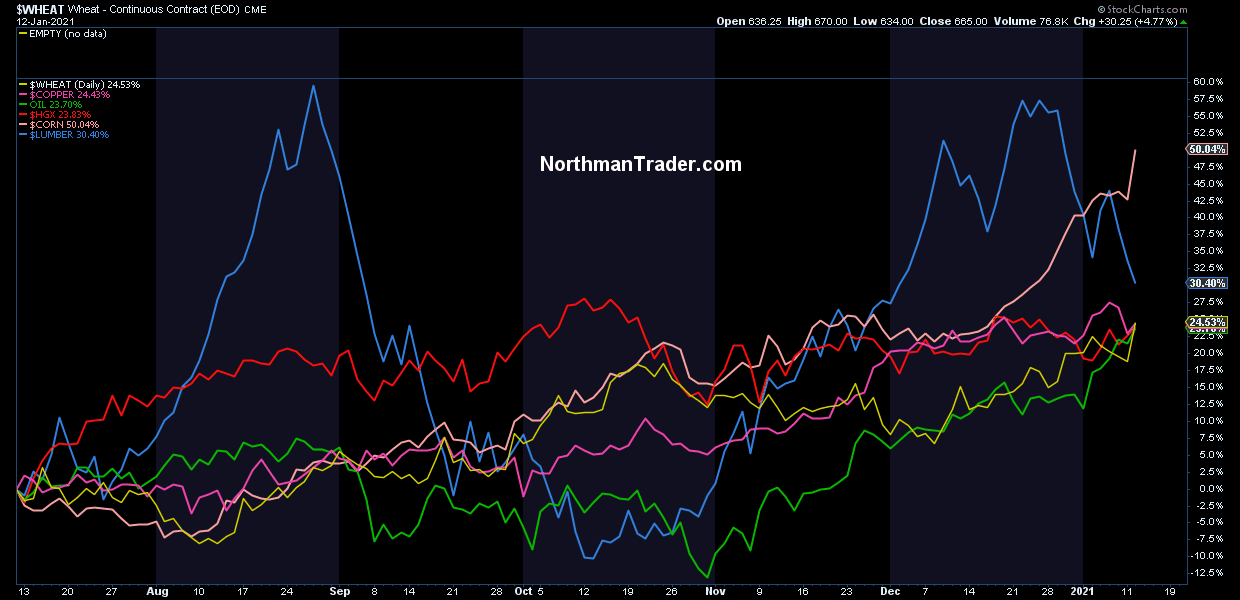
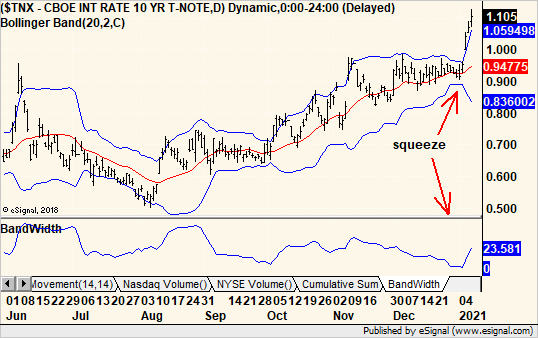
However, it’s sustainability depends on low interest rates which depend on low inflation which depends on a stable dollar. If the $ keeps falling, import and commodities price will continue to rise resulting in inflation and higher interest rates. This sort of development could tie the Fed’s hands as they turn their attention away from stimulus to controlling inflation (Chart Source: Mike Zaccardi Twitter, January 13, 12:32pm PST; Chart Source: NorthmanTrader Twitter, January 13, 3:48am PST; Chart Source: Michael Kahn Twitter, January 8, 1:03pm PST).
Despite their “overbought” status, we think that US equities have another year ahead of them and that the S&P 500 is likely to break through its psychological resistance of 4,000 within the next three to six months with a peak probably priced for early 2022 – Rothko Research Twitter, January 3, 5:34am PST
These second order effects of all the Fed stimulus is one of the main weaknesses in Rothko Research’s argument that liquidity will continue to propel stocks higher in 2021 (“Bad News Is Good News”, Rothko Research, SeekingAlpha, January 16). This is certainly the Fed’s intention but the second order effects of its policies, a declining dollar, increasing inflation and rising interest rates, could tie its hands.
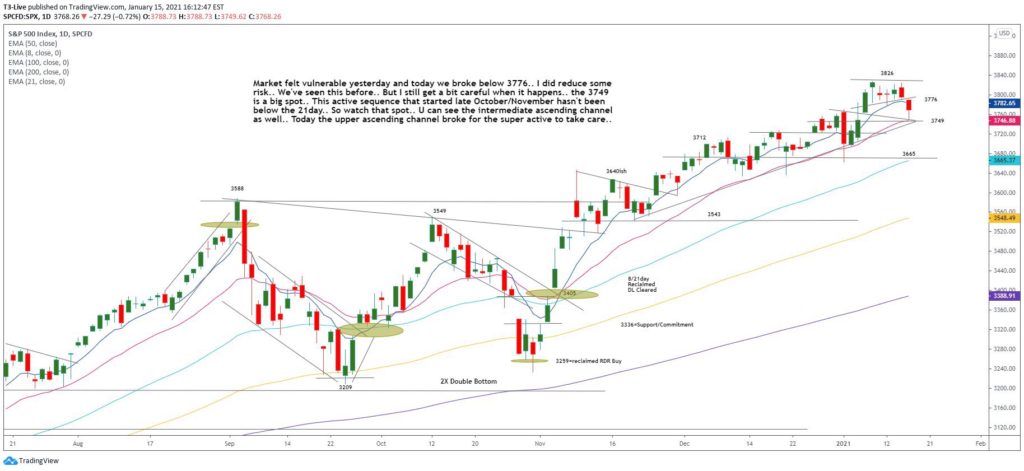
Turning now from the technicalities of bank balance sheets and macroeconomics, I want to take a quick look at an important level in the S&P according Scott Redler, one of the best short term traders and technicians in the world. Last week’s action had Scott taking down risk, reducing long positions in his trading account from 30 to 11, and writing after the close Friday that the 21 Day Exponential Moving Average (EDMA) at 3,749 is a “big spot” as we haven’t seen a close below that level since the current “active sequence” began about 2 1/2 months ago (Chart Source: Scott Redler Twitter, January 15, 1:20pm PST). The S&P closed Friday at 3,768.