
Indices In Consolidation Ahead Of FOMC
(Click on image to enlarge)
The end of the US government shut down doesn’t appear to have had a positive effect at the start of the new trading week. In fact the exact opposite with the three main US indices all falling sharply and looking to re-test significant support price levels.
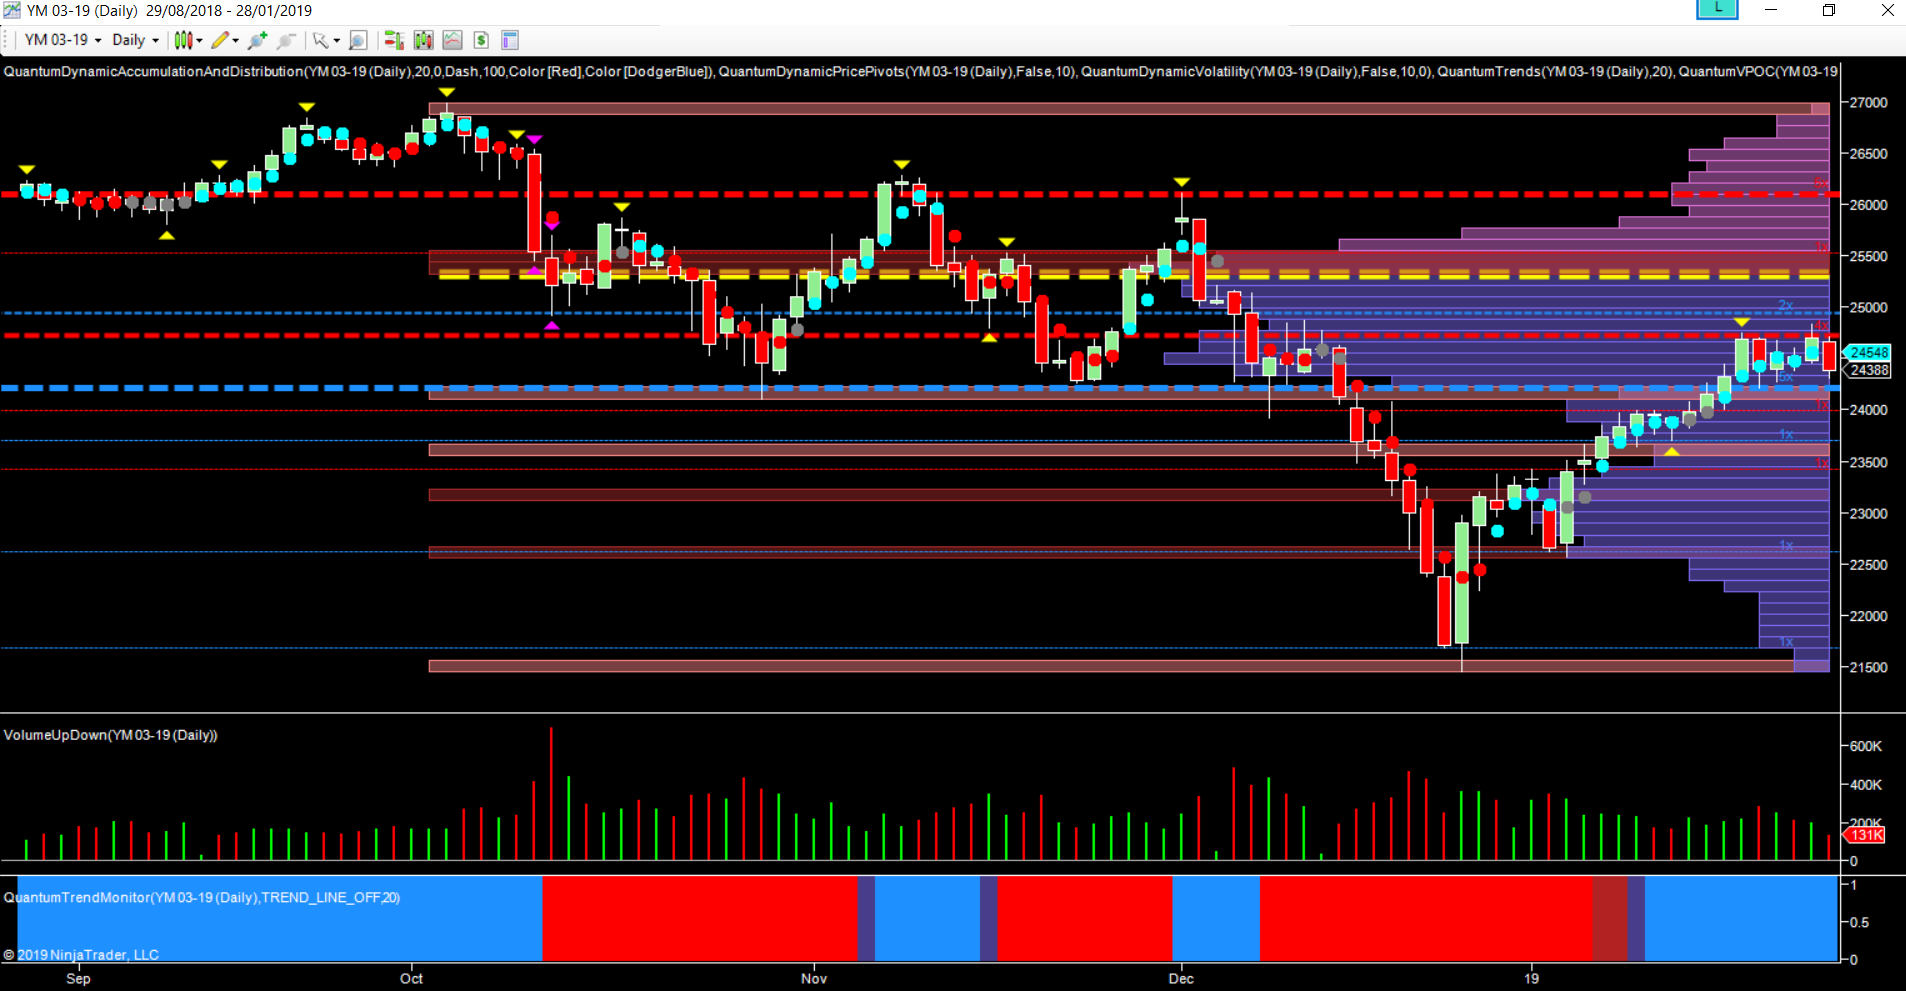
Starting with the YM (e-mini) for the Dow Jones the key level for the index is at the 24250 – 24300 region (as denoted by the blue line of the accumulation & distribution indicator) and is a support level that held all last week. To the upside, the 24700 is also key and forms the ceiling of the current consolidation for the index, although this resistance (as denoted by the red line of the accumulation & distribution indicator) is not as well developed as the support line.
(Click on image to enlarge)
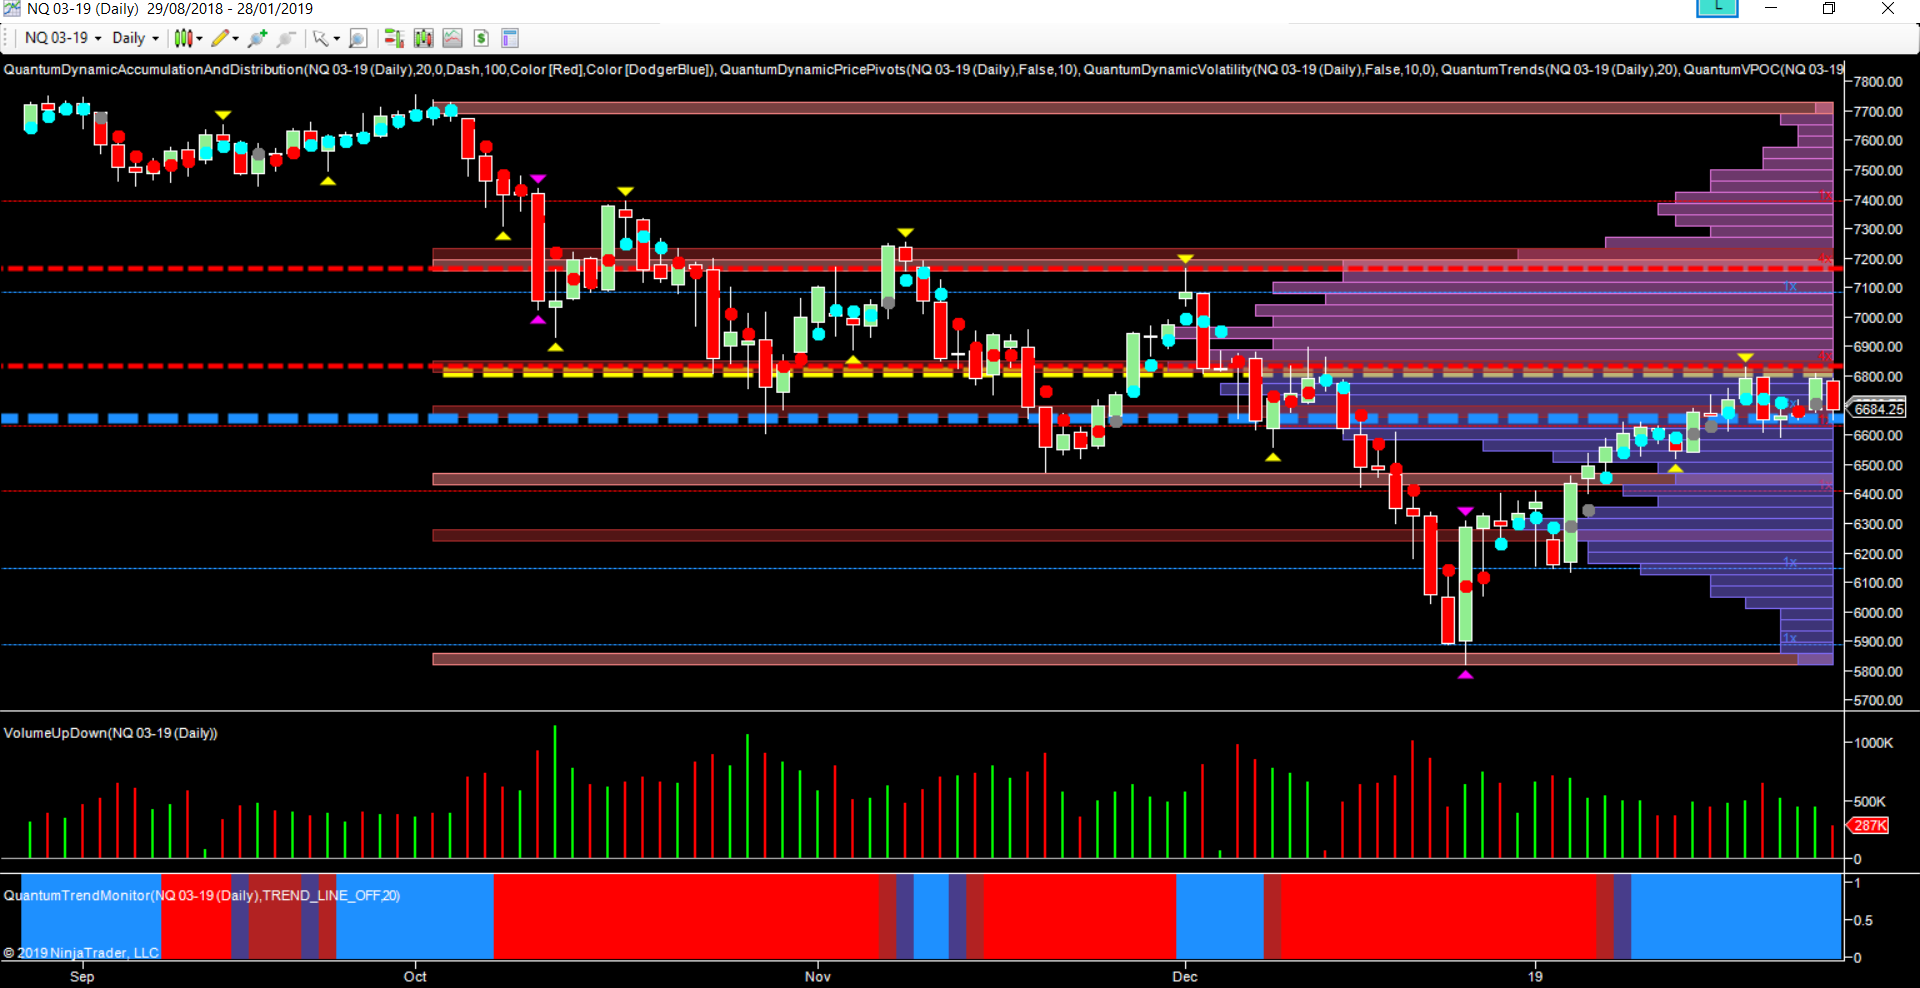
Moving to the NQ (e-mini for the Nasdaq) here too we have an index sandwiched between strong support in the 6660 region and resistance at 6800. However, the difference here is the volume point of control also sits at this price level thereby creating much strong resistance and a level that will require effort and volume if the index is to continue higher.
(Click on image to enlarge)
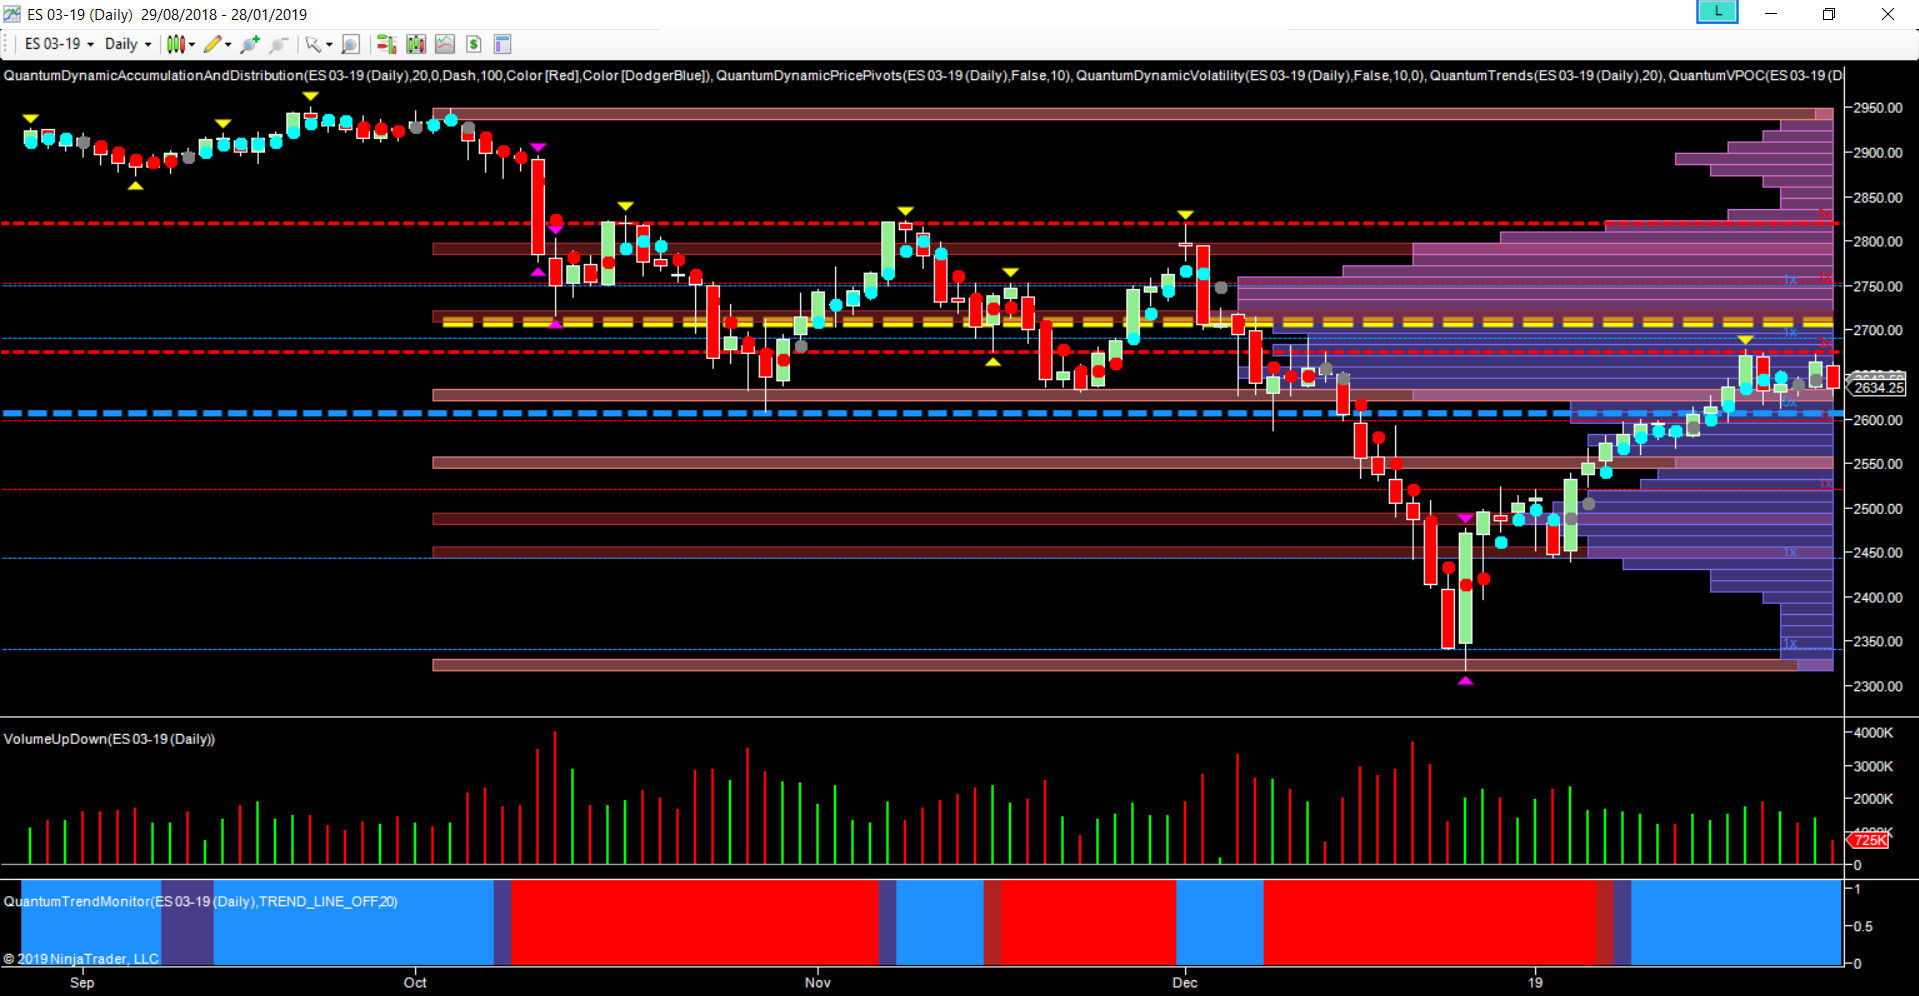
And the ES too is consolidating between strong support at 2610 and resistance at 2680 but at least on this chart, there is some distance to the volume point of control which sits at 2710.
The consistency of the price action on all three indices, reveals not only a natural pause to the recent strong move higher in equities but also a degree of uncertainty as market participants now wait for the FOMC on Wednesday, the usual raft of earnings data as well as China. And whilst all of these are capable of moving the indices out of their consolidation it is the FOMC that may provide the greater volatility particularly if Powell disappoints and fails to deliver a more dovish statement. This FOMC also ushers in a new era of press conferences after every meeting which will also add its own volatility.
(Click on image to enlarge)
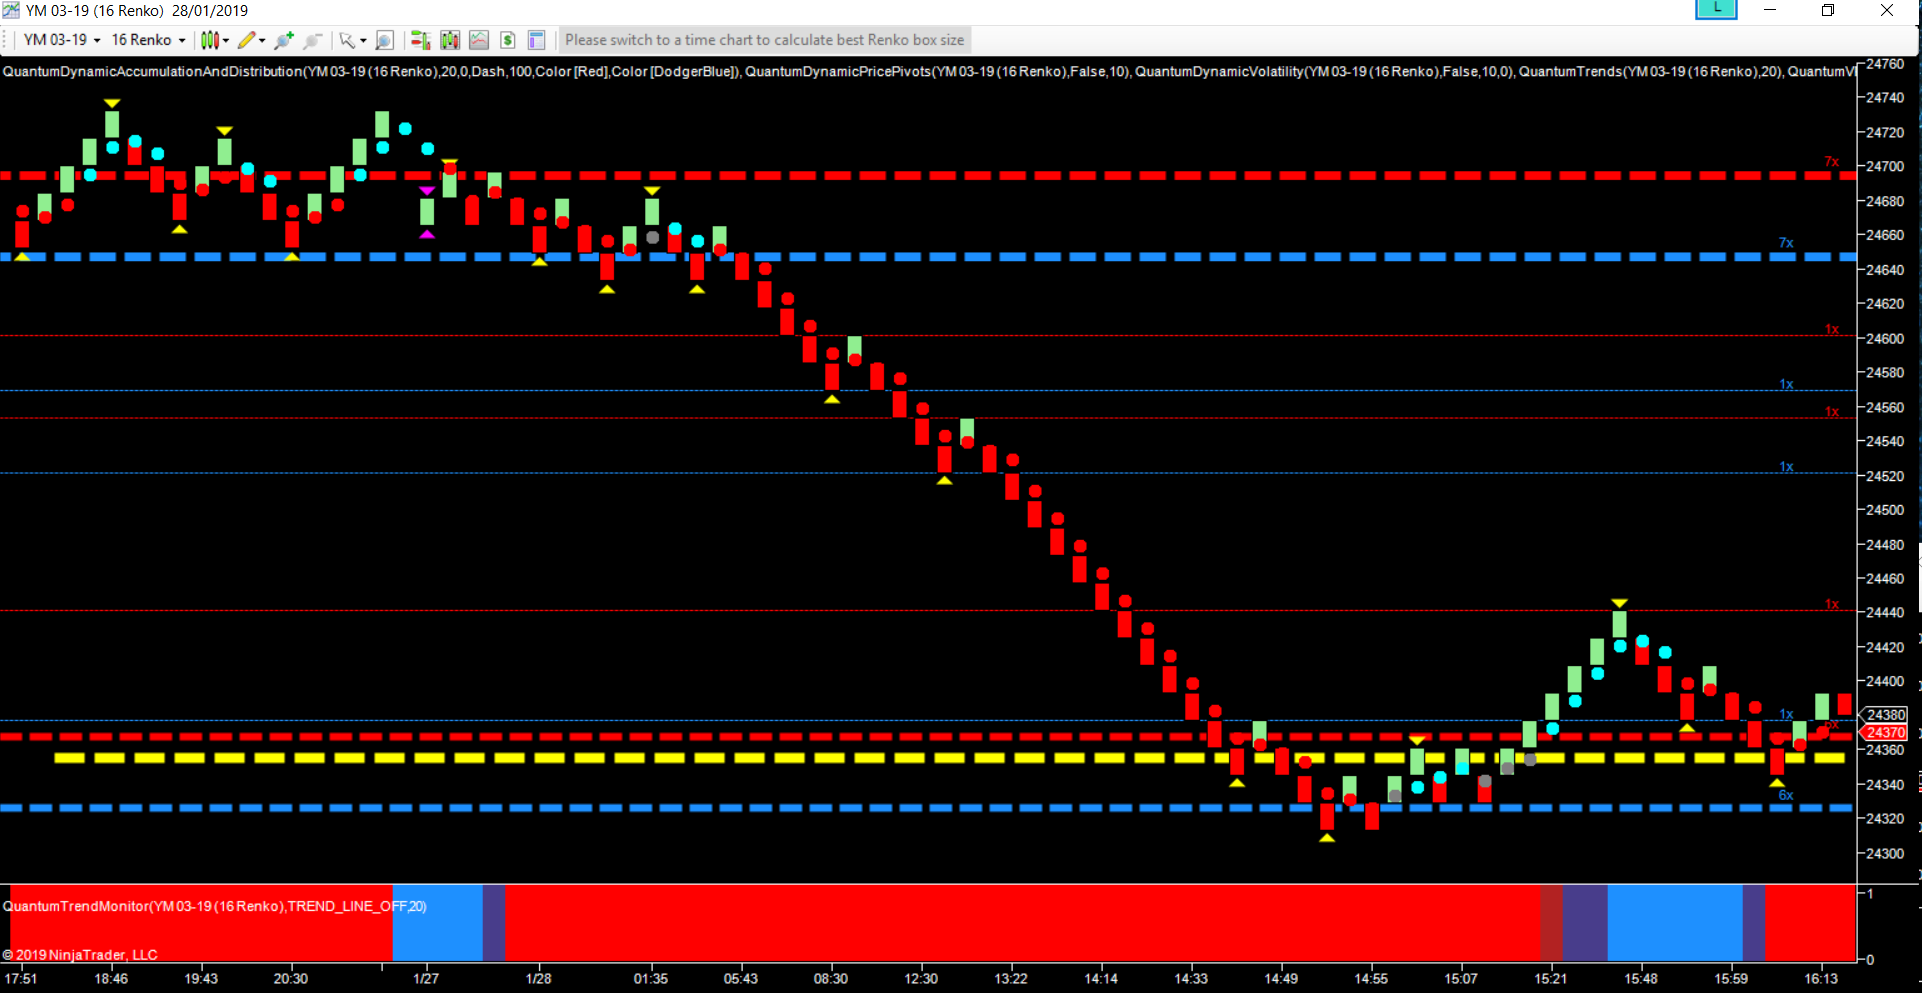
For intraday index traders the consolidative price action of the daily charts can be frustrating but with the key support and resistance levels now clearly defined solid swing trading opportunities will present themselves on the faster time frames, particularly when using a non-time-based chart such as a Renko. One such is as shown on the 16 Renko chart for the YM where the break lower from the volume point of control at 24700 led to a move of almost 400 points, and as we can see from the chart the support platform in the 24250-24300 region may once again come into play. And indeed since writing this post, the volume point of control has moved to this price region offering even greater support.
Disclaimer: Futures, stocks, and spot currency trading have large potential rewards, but also large potential risk. You must be aware of the risks and be willing to accept them in order to invest in ...
more

