
Index Investing And Housing Market Show Mixed Results
Index fund investing has become very popular in the past few years as investors love their low fees and hate how most fund managers underperform the market. There is a huge incentive for fund managers to spread negative information on index funds. We believe indexes are the best way to invest if you don’t have the inclination to do in-depth research. If you are reading this, you probably do invest on your own, but you can still tell your friends about the positives of index funds.
The biggest misleading information about index funds is that a high percentage of stocks in the Russell 3000 are losing money. Since the standard PE multiple calculations ignores the money losers, those against index funds and the bears say you need to be wary of them. The same has been said about the Russell 2000. The stat shared is that about 25% of Russell 3000 firms don’t make money. If someone is considering investing in the Russell 3000, they might get scared out of it especially because the percentage of money losers has increased over time. Investing in firms that lose money can be very risky and the fact that their percentage has gone up implies the index is overvalued.
Disappointed in the preference for viral charts vs data with context in latest GMO piece.
— Jake (@EconomPic) December 18, 2018
One example. ~25% of R3000 names don’t have earnings. But that’s almost all small caps / tiny biotech. Non-earners are ~7% by weight and ~1% by NTM projections. https://t.co/HAUSjpa3Rj pic.twitter.com/ogMgiIa5r6
The reality is that most of these firms that don’t make money are small biotech stocks. The smallest stocks have the least impact on the index which means investors who own the index have little exposure to these money losers. It’s highly unlikely these firms will impact the overall index meaningfully unless they become profitable, defeating the worry. The money losers represent 7% of the market weight by trailing earnings and 1% by next 12 month earnings.
Weighting Risk
When valuing international markets, make sure to track sector weightings. If you buy into a country that has a high weighting in financial stocks, that’s a de facto bet on the financials. It’s like how buying an American ETF that tracks the market is a de facto bet on the big internet names. The table below explains why American stocks have a higher return on equity than European stocks.
More on EU and US equity returns, this time from Barcap. H/T JJ for all these charts. 🙏 pic.twitter.com/8wqYiwL9nY
— CerroTorre (@_CerroTorre) February 20, 2019
The US has a 20% weighting in information technology while Europe only has a 5% weighting. Europe has double the consumer staples weighting.
To be clear, there are several categories to fall into when you review this. Some investors think competition will lower the return on equity of the high return sectors, evening everything out. Some think each country will eventually see a balancing where they all have similar sector weightings. Finally, some think they can’t pick which sectors will do well, so they don’t mind the weighting differences. These groups of people in this category won’t act on this sector weighting information.
However, it’s still important to know what you own and why valuations and returns are where they are. If you think you can pick the best sectors and that tech stocks have a structurally higher return on equity than sectors like materials, financials, and consumer staples, it would make sense to go overweight the American market and underweight the European market if they had similar multiples. Europe has a lower multiple, but its economy has had structurally less growth than America’s partially because of its lower population growth. These are all aspects to consider when deciding how to weight your portfolio geographically.
Where Is The Earnings Recession?
The table below shows earnings estimates have slowed their descent in the past couple weeks. That’s because there have been fewer firms reporting earnings, so there were fewer chances for firms to issue negative guidance which would catalyze negative estimate revisions. That’s not a great reason for estimates to stop cratering, but at least 2019 estimate declines will stabilize in the next few weeks before Q1 earnings season starts.
With less $SPY co’s reporting, overall EPS est cuts should soon abate. A more charitable Fed should help too. Markets are discounting this. pic.twitter.com/wg7y4d6R9X
— The Earnings Scout (@EarningsScout) February 21, 2019
Keep in mind, that if Q1 estimates expect a small decline, estimate beats can change that to a gain which would stop the potential earnings recession in its tracks. Q2 estimates still have a lot to fall to support the earnings recession thesis. This is a weak earnings recession anyway because it is being driven by insanely tough comparisons in rate of change terms. Revenue growth, which doesn’t have as tough comparisons is expected to be in the mid-single digits in Q1. That doesn’t support the negativity surrounding the potential for a bear market and earnings recession.
Strong Housing Market Index & MBA Applications
Now we will review the 3 latest housing market data points. The first is the February housing market index which increased from 58 to 62, beating estimates for 59. It beat the high end of the consensus range which was 60. The present sales index was up 3 points to 67, the 6-month sales index increased 5 points to 68, and the traffic index increased 4 points to 48 which still signals a decline. The strength of this report was probably catalyzed by declining mortgage rates. The 30-year mortgage rate fell from 4.94% in November to 4.37% as of February 21st. The West was the strongest region as its index was 67. The South was at 66, the Midwest increased to 55, and the Northeast fell to 45.
The weekly MBA applications index was up 3.6% after falling 3.7%. The purchase index was up 1.7% for a yearly increase of 2.5%. That followed a weekly decline of 6%. The refinance index increased 6.4% from a decline of 0.1%. Some homeowners who purchased 3 months ago will want to refinance their loan already.
Poor January Existing Home Sales Report
Existing home sales were very weak in January as the chart below shows.
So, even with today's Existing home sales coming in as a miss and down 8.5% YoY, it still looks right to me pic.twitter.com/UF7J4Gtic5
— Logan Mohtashami (@LoganMohtashami) February 21, 2019
Sales fell from 5 million to 4.94 million which missed estimates for 5.04 million. This was a 3 year low. Monthly growth was -1.2% and yearly growth was -8.5%. Home sales were down 1.8% (4.37 million rate) and condo sales were up 3.6% (570,000 rate). Median monthly home prices fell 2.8% to $247,500. They were up 2.8% yearly. Discounting helped boost sales, but they still fell. The 2.8% gain was the weakest growth since 2012.
Supply increased from 3.7 months to 3.9 months as resales on the market increased by 3.9%. That’s bad for prices, but good for the market because supply has been very low in the past few years. Resales fell 2.9% monthly and 13.8% yearly in the West to a rate of 1 million. The South saw a 1% monthly decline and an 8.4% yearly decline to 2.08 million.
No Recession Driven By Housing
The chart below shows adjusted for population, existing home sales fell 19.5% yearly and have been falling the entire cycle. This shows how small the housing market has gotten.
(Click on image to enlarge)
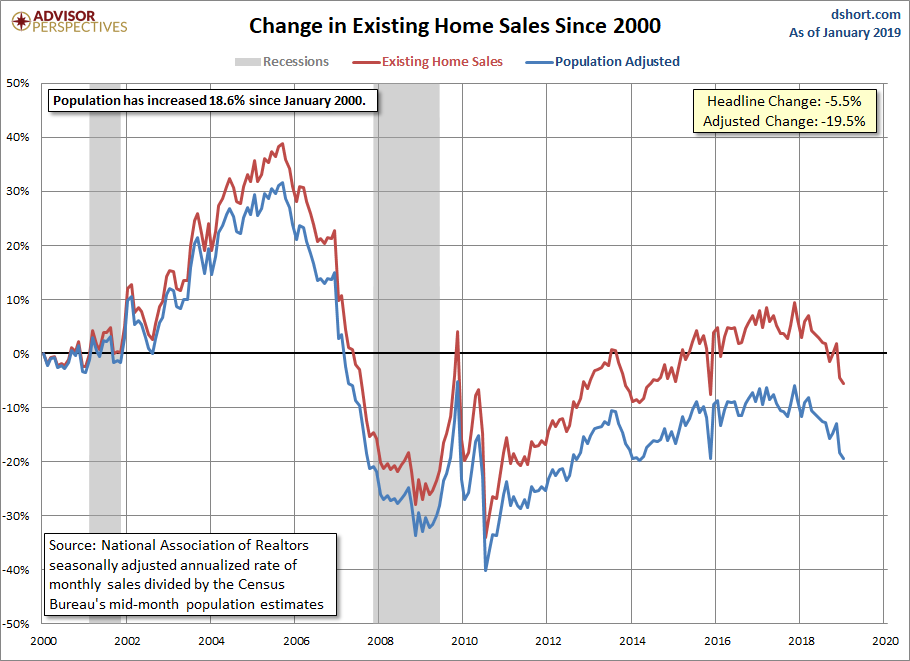
It would be impossible for the housing market to catalyze a recession like it did last cycle when the population adjusted existing home sales growth exploded.
Disclaimer: Please familiarize yourself with our full disclaimer here.


