
Impact On Stocks: QT, Shutdown & EPS Estimates
Opinions on the Fed’s balance sheet and QE have a huge variance. Some investors blame the entire bull market on QE even though stocks rose after QE 3 ended. These investors tend to think the Fed will go through with QE 4 at the first sign of trouble in the economy. On the other side, some investors think QE is an asset swap that has little effect on the economy or stocks. We are discussing the latest news on the balance sheet because the stock market has been reacting to Powell’s statements on it in the past few weeks.
Specifically, stocks fell in December when Powell stated the shrinkage was on “autopilot” mode. It’s possible some traders thought hawkish balance sheet talk meant hawkish talk on rates. It’s also possible traders were fearful Powell wouldn’t react to changes in the economy. The term autopilot implies the person in charge isn’t paying attention.
After the stock market fell in December, Powell softened his remarks in early January stating, “We wouldn’t hesitate to change it and that would include the balance sheet. We’re hearing a lot from different groups of people about the role the balance sheet normalization may be playing in the market.” The stock market didn’t like autopilot, so Powell changed his language.
Now let’s review Powell’s latest statements on January 10th. Powell stated the balance sheet “will be substantially smaller than it is now.” As you can see from the chart below, the balance sheet has shrunken $402 billion to about $4 trillion.
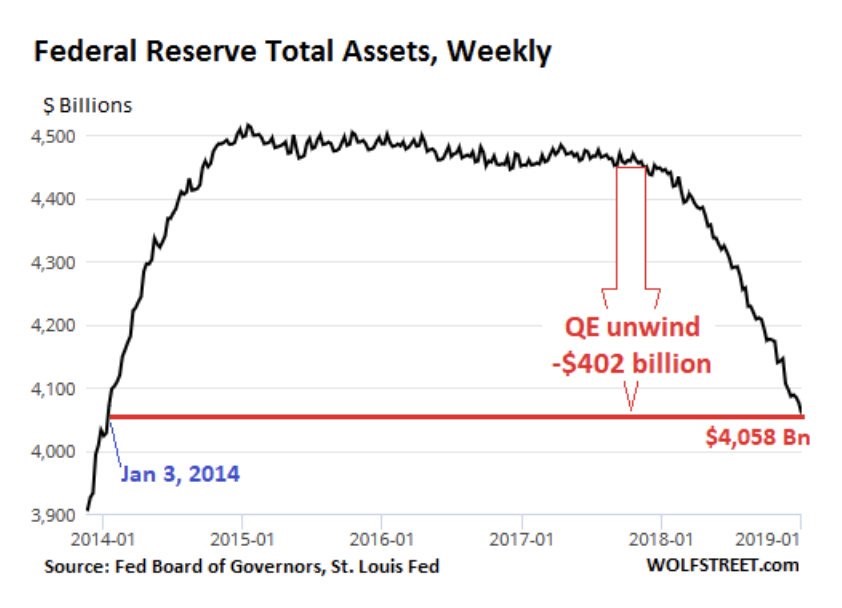
Source: WolfStreet.com
The Fed is still on the path of reducing the balance sheet by $50 billion per month. Powell also stated the balance sheet will be “nowhere near where it was before.” This means it will be nowhere near about $900 billion since that’s where it was before QE 1. Being somewhere between $4 trillion and $900 billion is a very wide range. The discussion about when the balance reduction will end will likely gain traction in 2020 which is when the balance sheet will decline below $3 trillion. This assumes there is at most a slowdown in 2019, and not a recession, which could potentially cause the Fed to shift its stance.
Mistaken Analysis
The $50 billion per month unwind is $20 billion in mortgage-backed securities and $30 billion in Treasuries. The chart below was created by Morgan Stanley’s quant team.
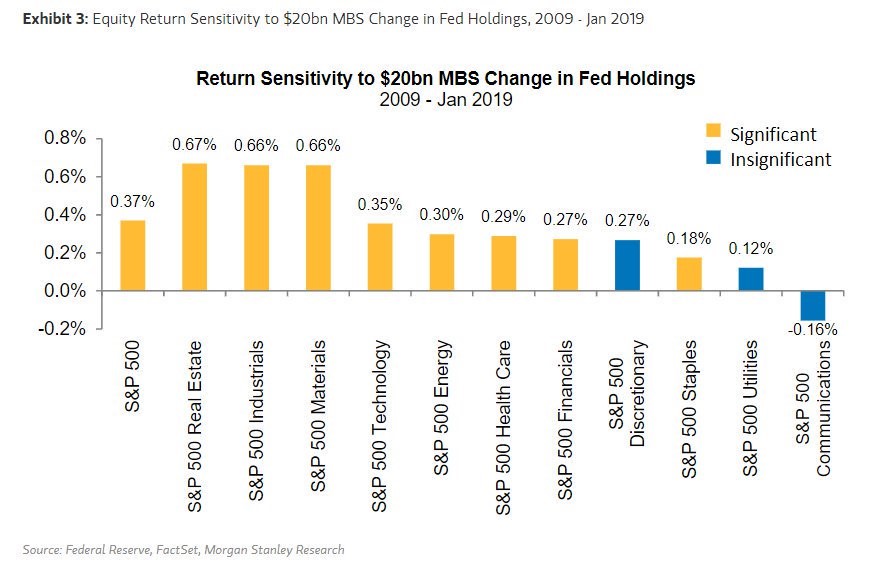
Source: Morgan Stanley
It shows that every $20 billion decline in the Fed’s mortgage-backed securities holdings hurts the S&P 500 by 0.37%. The team also concluded the decline in the Treasury holdings has no effect on stocks. We think this is faulty analysis.
The math is correct, but in our view could be mistaking correlation with causation. Just because stocks reacted a certain way during QE and the unwind doesn’t give us certainty that the change affects stocks. It’s difficult to conceptualize what a 0.37% decline is after you consider all the other variables affecting markets, and what the market would do anyway based on fundamentals. Either way, we would not solely rely on this sensitivity analysis to forecast stock returns during the era of quantitative tightening.
Stocks Ignore The Government Shutdown
This government shutdown, which is the about to become the longest in US history, is also unique in that stocks have done very well during it. As you can see from the table below, stocks have had the best performance during a government shutdown ever in the past couple of weeks.
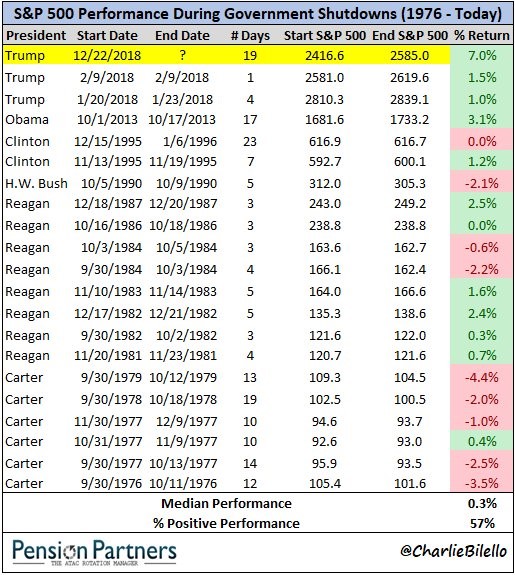
Source: Pension Partners
It’s wrong to suggest stocks are rallying because of the shutdown. It’s simply that stocks were oversold when the shutdown started, and traders are ignoring it. If anything, the shutdown could be negative for the economy.
JP Morgan stated the government shutdown hurts GDP growth by between 0.1% and 0.2% every week. Because of this, JP Morgan lowered its Q1 2019 GDP growth estimate from 2.25% to 2%. That only reflects the first 2 weeks of the shutdown. The longer it lasts, the bigger the negative impact.
Decline In Global Earnings Estimates
With the global slowdown impacting countries such as Germany, Japan, and China, it’s no surprise analysts are lowering their earnings estimates. The number of analysts lowering their estimates is impressive though. As you can see from the Bloomberg chart below, analysts’ profit cuts are exceeding upgrades by the most since 2009.
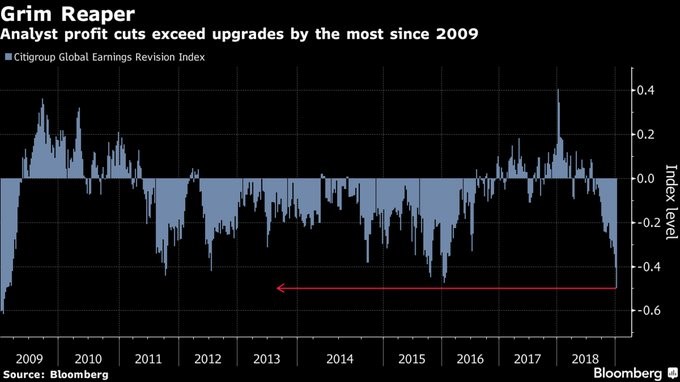
Source: Bloomberg
Even with all these downgrades, the MSCI ACWI which tracks global equities is up 9.28% since Christmas Eve. It appears a lot of the negativity has been priced in as last year’s selloff brought global equity valuations to a 5 year low. We will need to keep an eye on European and Chinese economic data to see if the global slowdown continues. It’s not a given that it will continue just because of these analyst revisions, which have come late since the slowdown has been going on for months.
S&P 500 Estimate Declines
One of the biggest trends we have focused on in our articles is the sharp decline in S&P 500 earnings estimates. Everyone knew Q3 2018 would be the last quarter with over 20% earnings growth, but the size of the slowdown in growth is an unknown. That is the biggest risk that is hardest to anticipate, the rate of change of earnings. This, in large part, is what determines the likelihood of a recession versus a simple economic slowdown. Obviously, if earnings end up declining in 2019, it would be a major problem for equities unless multiples explode higher. As you can see from the chart below, the rate of change of bottom-up estimates has worsened in each of the past 3 quarters.
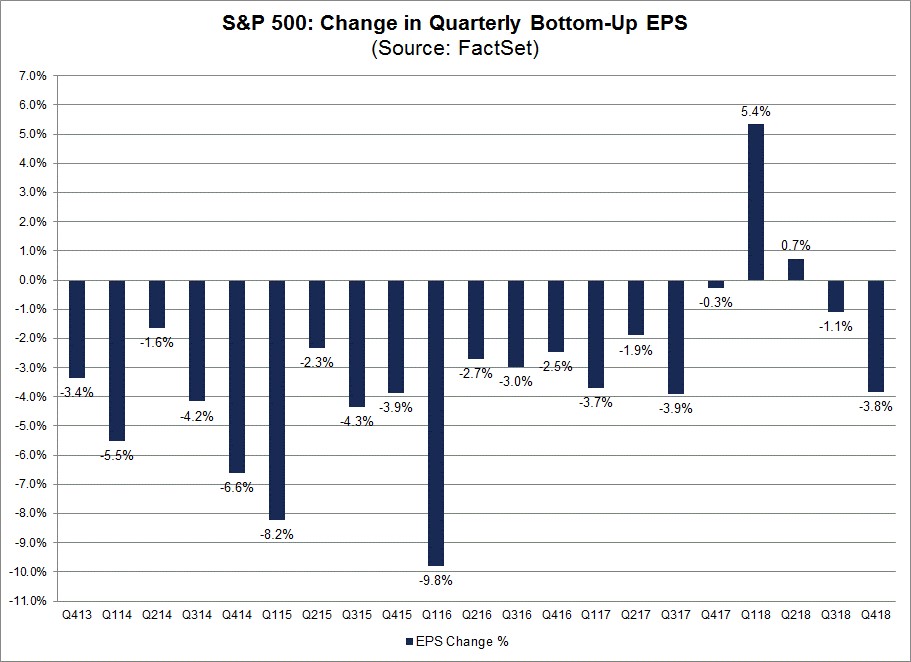
Source: FactSet
The 3.8% decline in Q4 estimates is worse than the 5-year average which is 3.1% but better than the 10-year and 15-year averages which are 4.5% and 3.9%. The first 3 quarters of 2018 were significantly above average. Q4 is simply a return to normalcy.
The chart below shows the changes to earnings estimates for the following year in Q4.
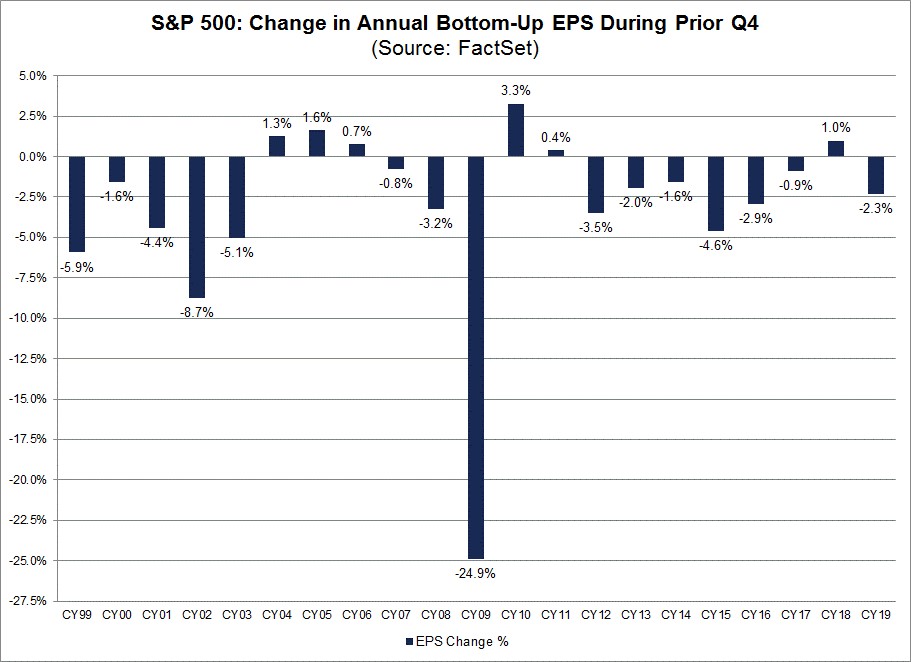
Source: FactSet
2019 estimates fell 2.3% in Q4 2018. That’s the worst performance since 2016. This decline is worse than the 5-year average which is -1.8% but is better than the 10-year, 15-year, and 20-year average declines in estimates which are 3.6%, 2.4%, and 3.1%. Earnings estimate declines will only be a problem if they keep declining and push growth negative for 2019.
Conclusion
The Fed will continue shrinking the balance sheet at a rate of $50 billion per month for at least the next year. Stocks have done well under the shutdown, but GDP growth will be hurt substantially if it continues. Growth might be less than 2% in Q1. Analysts are lowering global earnings estimates, but the declines are priced in. Let’s see if the slowdown continues before being too negative. The estimate declines for Q4 2018 and 2019 have been severe, but they are still relatively normal. It will only be a problem for stocks if earnings fall outright in 2019.
Disclaimer: Please familiarize yourself with our full disclaimer here.


