
Impact Of Household Debt & Key Labor Market Indicator
Unfortunately, it’s very common for journalists/traders to misrepresent the NY Fed’s Household Debt and Credit report because it has droves of interesting information. The most transparent way to misrepresent the data is to obsess about how much debt consumers have without contextualizing the results. Household debt to income is low compared to the last cycle because consumers deleveraged. The other aspect which is misrepresented is when one negative point is cherry picked out of an otherwise solid report.
In Q4, household debt increased 0.2%, which is $32 billion, to $13.54 trillion. This is a new record as debt is $869 billion higher than the previous cycle peak in Q3 2008 and 21.4% higher than the trough in Q3 2013. Just because debt has increased doesn’t mean leverage has. This cycle has been dominated by non-housing debt, namely student and auto loans. That makes sense because the housing bubble bust removed the excess in the market. The Q4 report continued this trend as housing debt fell from $9.56 trillion to $9.54 trillion and non-housing debt rose from $3.95 trillion to $4.01 trillion.
Percent Of Balance 90+ Days Delinquent Loans Steady
The cherry-picked headline is that auto’s 90+ day delinquent loans increased from 4.3% to 4.5%. However, the other categories all fell or were the same. Aggregate delinquencies were steady at 4.7%. As you can see from the chart below, student loan delinquency rates continue to be elevated.
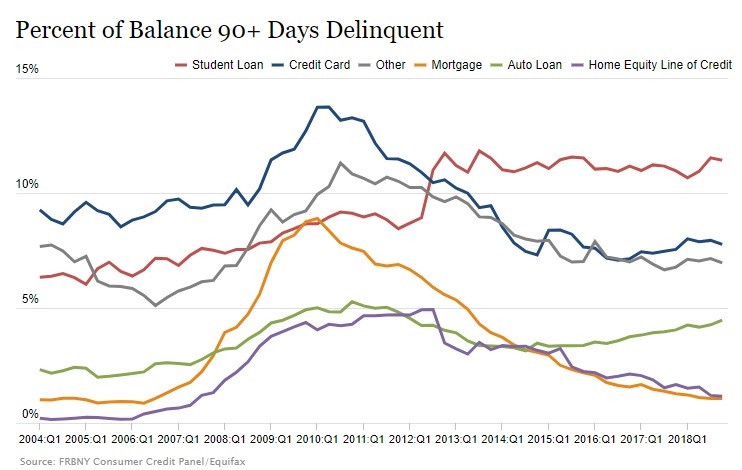
The scary aspect is this is the delinquency rate in an economy with a strong labor market. Imagine how much it will increase during the next recession. It could surpass the cycle peak for credit cards in 2010 even if it’s a mild recession. The student loan delinquency rate fell from 11.5% to 11.4%. Credit card delinquencies peaked at 13.7% in 2010. Mortgage and HELOC delinquencies are very low.
Consumers might be getting smarter about credit cards as the number of accounts closed has been increasing, albeit to a similar level in the previous cycle. The number of new accounts has been stable in the past few years and it’s also below the previous cycle. The number of credit card inquiries in the past 6 months fell to near the level it troughed at right after the last recession.
Possibly because the auto loan delinquency rate increased, auto loans were given to borrowers with higher credit scores. The 50th percentile ticked up slightly to further above 700. It’s notable that the flow into 90+ day auto loan delinquencies has been increasing since 2012. This report doesn’t show a new trend. We aren’t trying to sugar coat this negative data point. Last cycle’s recession peak was only slightly higher at 5.3%. We’re just guarding against recession talk. The flow into credit card delinquencies has been increasing since 2017, but it’s below where it was at the end of the last expansion, making it less of a problem than auto debt.
Household Debt By Age Group
As you can see from the chart below, those over 30 have over 60% of their debt in housing, while those 18-29 are stuck with a lot of student debt. It’s amazing how student loans have grown from $260 billion in Q1 2004 to $1.46 trillion now. That growth has come from borrowers ages 18-29 and 30-39.
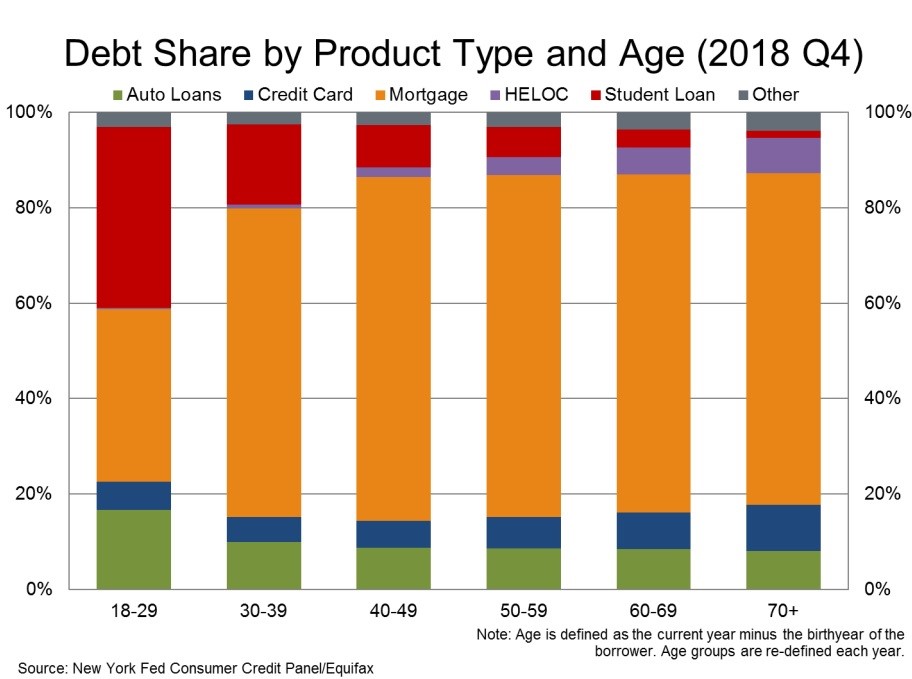
Those ages 18-29 have the highest percentage of loan balances transitioning into serious delinquency (90+) day status. Surprisingly, this age group leads the way in auto loan and credit card loan delinquency transitions, but not student loans. However, 18-29 year old’s overall delinquency rate increases because of the high weighting in student loans which have a high delinquency rate for all ages. Those ages 18-29 have the lowest percentage of student loans transitioning to delinquency, while 40-49-year-olds have the highest rate. This is probably because the older the student loan, the more likely a borrower is to go delinquent.
Millennials Are Delaying Marriage & Kids
Millennials still have the propensity to consume like other generations, but they are delaying key life decisions. This is being catalyzed by the increase of women in the workplace and student loan debt (also shifting cultural norms). As you can see from the first chart on the top left, the percentage of men and women who have never married has increased from 29.6% and 22.5% in 1980 to 34.9% and 29.3% in 2017. That’s because the average age men and women get married first has increased from 24.7 and 22 to 29.5 and 27.4.
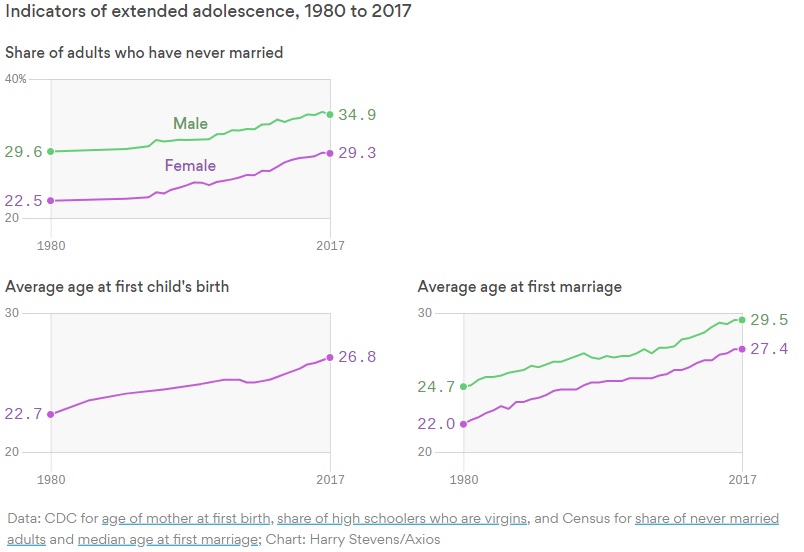
The average age at first child’s birth has increased from 22.7 to 26.8. The biological window to have kids is shrinking for women. The good news is modern medicine makes easier to have kids at older ages.
Prime Age Workers Are Finding Jobs
The best way to determine if the labor market is filling up is to look at the flow of unemployed people getting jobs. As you can see from the charts below, the prime age people getting jobs in each stage of being unemployed has increased cyclically because the labor market is strong.
Yet look at these rates for workers 25 to 54 years old and job finding rates for LTU is above the dropping out rate and has been for years. pic.twitter.com/eC784vk6Qs
— Nick Bunker (@nick_bunker) February 12, 2019
Even for people unemployed for 27 weeks or more, there’s a decent gap between those getting jobs and those dropping out of the labor market. The stat is reversed for those 55 and over as more drop out of the labor market once they are unemployed for 15 weeks or more.
Prime Age Labor Market Slack
The chart below shows the categories of labor supply in the labor market for the prime age population.
I'm getting better at placing data labels directly in my charts but it's a clunky process in Stata. pic.twitter.com/QF5hABEvg9
— Ernie Tedeschi (@ernietedeschi) February 12, 2019
Currently, being involuntarily part-time is the largest percentage of slack. That means workers filling full-time jobs will come from working part-time the most. The slack from disabled workers has been decreasing the most lately. When the long term unemployed and involuntary part-time slacks fall to the level of March 2001, the labor market will be full.
Conclusion
Consumers aren’t overly indebted, but the increased delinquency rate for credit cards and auto loans should be watched closely. Student loans have risen exponentially in the past 15 years. That partially explains why millennials are delaying having kids and getting married. The labor market is strong so being unemployed for a long time doesn’t mean you won’t be able to find a job. There is still modest supply in the labor market for prime-age workers in the categories of involuntarily working part-time and long term unemployed.
UPFINA's Mission: The pursuit of truth in finance and economics to form an unbiased view of current events in order to understand human action, its causes and effects. Read about ...
more

