
If The Market Is Broken... Nifty 9 Must Knows!
Welcome to another trading week!! In appreciation of all of our daily readers of finomgroup.com content, we offer the following excerpts from our Weekly Research Report. Our weekly report is extremely detailed and has proven to help guide investors and traders during all types of market conditions with thoughtful insights and analysis, graphs, studies, and historical data/analogues.
Research Report Insight #1
The title of this week’s Research Report should also be recognized as a characterization of the last 10-months worth of price action. The conditions of the world economy and financial markets was about as bad as it gets. Nobody anticipated or forecasted the following 10-month period to produce the greatest bull market rebound in history. This reminds me of a book of poems I read from Tupac Shakur back in 2000. Believe it or not, my first job out of college was as a high school English teacher in Miami Dade, Florida. This is one of the worst 10 school districts in all of the United States. Inner-city demographics and high-security risks. I left the teaching profession in short order, but will always remember teaching this book of poetry to my students, which proved common ground when explored.
The title of Tupac’s poetry book is The Rose That Grew From Concrete, and while perceived as “low brow” materials by the punditry, it proved profound for its time, and in my humble opinion for the current day. What I liken the visual to is that which happened to financial markets and the world in 2020. What we’ve seen since is the most unlikely and inconceivable recovery process, akin to a rose growing from beneath the concrete.

One of my favorite poems from Tupac was a seemingly simple play on words:
“When will the world find peace? When the world falls to pieces!”
Research Report Insight #2
The percentage of stocks trading above their 10-DMA has a more material breakdown and call to action. When the percentage of stocks trading above this rapid moving average gets to roughly ~10%, it has historically been a clear “buy signal”. One can be found nibbling above this breadth breakdown level, but a great degree of buying is suggested when it gets to the 10% level, which is highlighted in the chart (circles). Below is the breadth indicator to end the trading week:
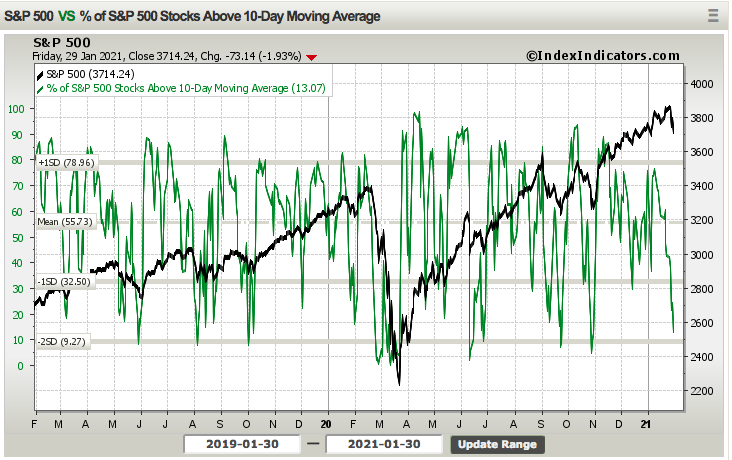
This breadth indicator continued to fall as the S&P 500 fell ~2% on Friday, finishing the week at a level of 13.07%, and very close to the 10% level. Yes, the breadth indicator can breach the 10% level, even if ever so modestly, but it doesn’t spend much time around this level before the buyers step in and bid up the market once again.
Research Report Insight #3
- One dynamic market variable that is also unchartered and unique to the current cycle is market liquidity.
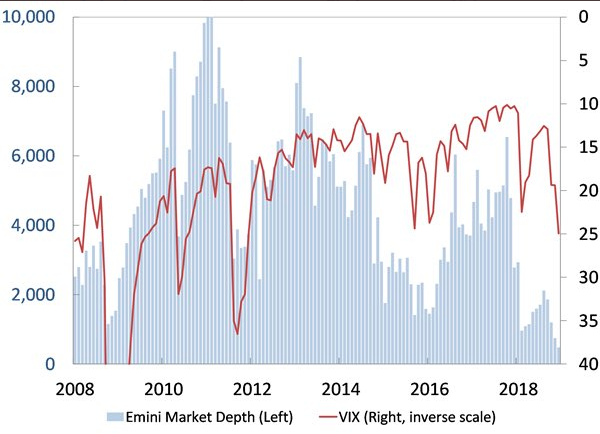
Equity market liquidity is defined by the average number of S&P 500 futures contracts trading within 1 index point of the top of the book. As you can see, in December 2020 the market depth was awful. Obviously also linked to volatility, but in December it was even weaker than at the depth of the Great Financial Crisis. The equity market liquidity has witnessed low-level market liquidity from 2017 to present and without a rationale as to what might sustainably improve liquidity going forward.
Why is market liquidity an important concept to understand. We can think of the market as one would the Titanic. In the water, it operates as it should, navigating the high seas. On dry land, it ceases to function normally. The market paradigm since 2017 is like a massive ship stranded in the sand.

Liquidity has been drained from the market as the ocean drained from around the ship. So how does the market/ship change course? When in an uptrend, the market would need a massive deleveraging, exogenous event. Remember, how we entered 2021 is no different than how we entered 2018 or 2020, it took an exogenous event in both years to change the course of the market i.e. Volmageddon and the Pandemic. While we can certainly have corrections to the course, an outright change in trend is very difficult in low liquidity environments and reinforces the policy implementation impulse.
Research Report Insight #4
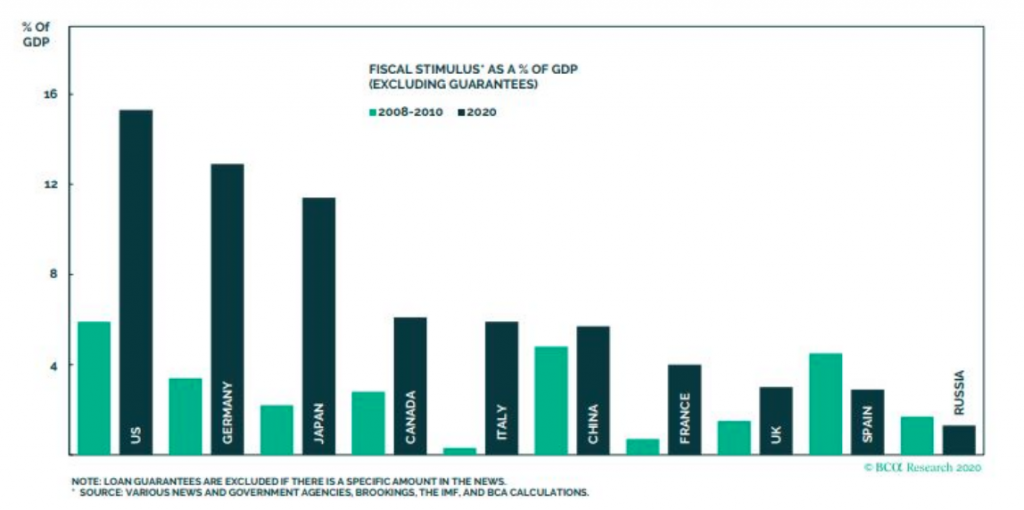
The chart below recognizes the amount of fiscal relief around the world, aimed at fighting the adverse affects from the pandemic. The chart doesn’t even reflect the January 2021 fiscal relief package passed. Now, I’ll attempt to briefly offer some points of interest on the recent economic data before delving into earnings season results, which are of greater investor importance.
Research Report Insight #5
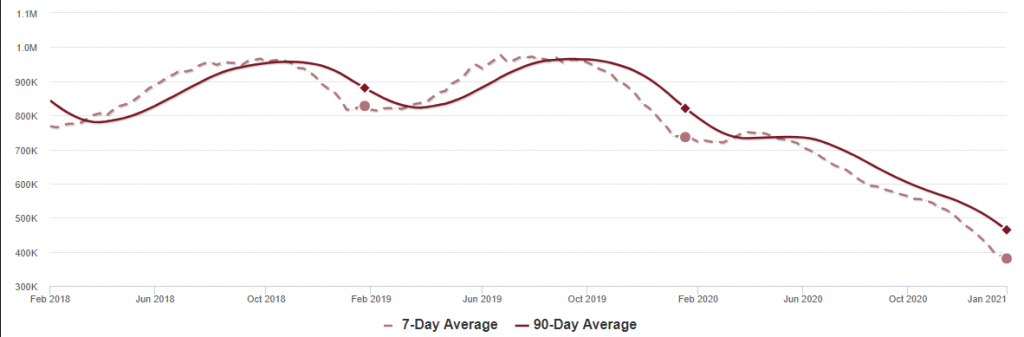
New Home sales inventory is just off of the record low levels seen in September 2020. When we look at total home sales inventory, however, it remains at record low levels. (New, Existing, Pending home sales inventory) As of January 22nd, inventory is at 380 thousand (7-day average), compared to 736 thousand the same week a year ago. That is a decline of 48%. A week ago, inventory was at 389 thousand, and seasonally inventory should bottom soon.
Research Report Insight #6
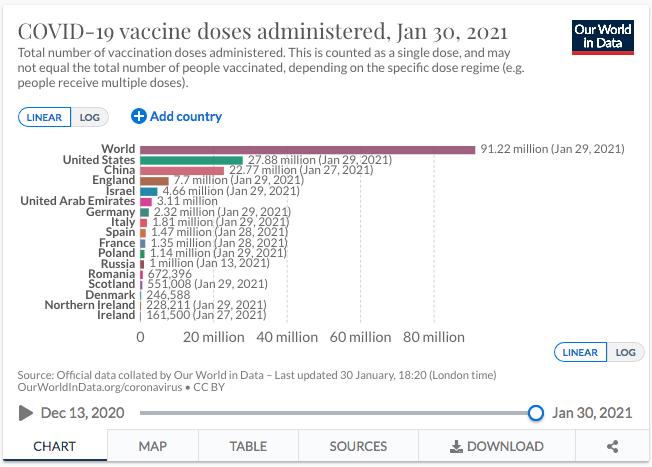
To date, nearly 28mm Americans have been vaccinated.
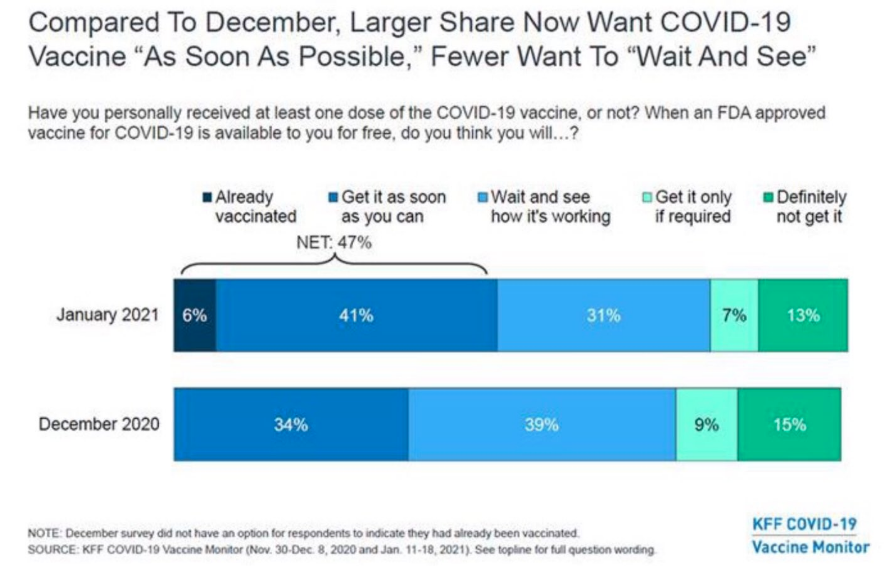
Additionally, it may prove encouraging to see, in addition to those already vaccinated, increases in individuals who want to get the Covid vaccine as soon as possible:
Research Report Insight #7
After 2 full weeks of earnings season, and as I estimated, FactSet has continued to positively revise their tracking model. As of today, the S&P 500 is reporting a year-over-year decline in earnings of -2.3%, compared to a year-over-year decline in earnings of -4.8% last week and a year-over-year decline in earnings of -9.3% at the end of the fourth quarter.
Positive earnings surprises reported by companies in the Information Technology sector, partially offset by a negative earnings surprise reported by a company in the Industrials sector, were mainly responsible for the decrease in the overall earnings decline during the past week. Positive earnings surprises reported by companies in the Financials and Information Technology sectors, partially offset by a negative earnings surprise reported by a company in the Industrials sector, have been mainly responsible for the decrease in the overall earnings decline since the end of the fourth quarter.
Insight/2021/01.2021/01.29.2021_EI/S%26P%20500%20Earnings%20Growth%20Q4%202020.png?width=920&name=S%26P%20500%20Earnings%20Growth%20Q4%202020.png)
Research Report Insight #8
Multiple or P/E expansion and contractions tend to work in super-cycles, that is to say over extended periods of time.
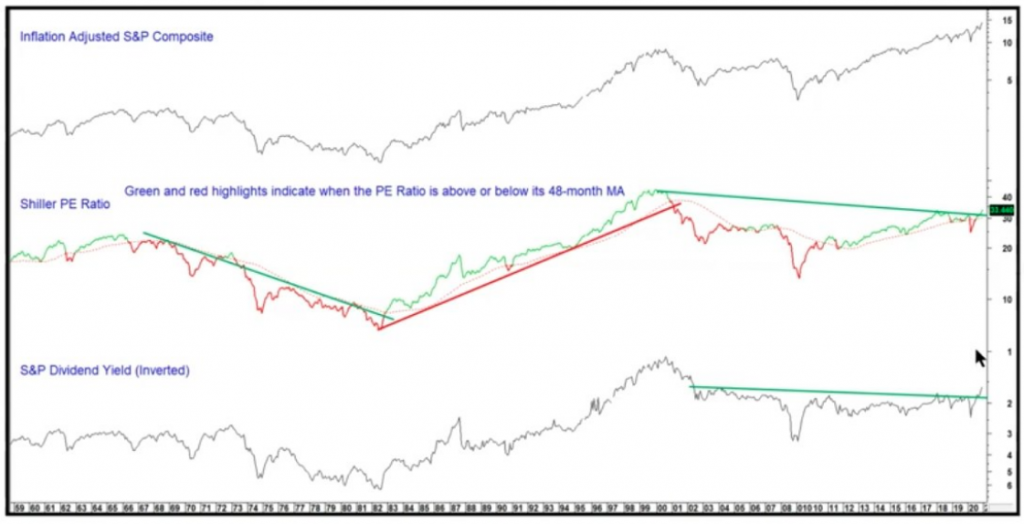
Based on the chart of the Shiller P/E ratio dating back to the 1960s, it would not surprise me if we were on the cusp of another P/E expansion super-cycle that finds the average 10-year P/E ratio above that of the previous cycle average. I had previously offered, coming out of the 2020 bear market, that we should not be surprise to witness the S&P 500 forward 12-month P/E ratio range between 18-25 over the next 10 years. We have already seen a break above the trend line in the Shiller P/E ratio shown in the chart above.
Research Report Insight #9
We are still recognizing that the 2009-2010 analogue is still mirroring the 2020-2021 market performance.

Although the 2010 market correction began a few days before it began in 2021, it appears on a like path once again even if on a different plane of time. The magnitude of the decline in 2010 was 8.2% and before resurrecting the bullish trend with new relief rally highs. Since the roadmap appears to still be working, it probably makes sense to consider that the pullback may not yet be over. That is not to say that it will exceed 8%; while that is certainly possible, I do believe it could exceed 5% before a “buy signal” is delivered. This analogue remains very much in play and on the radar.
Thank you for joining us for another trading week and reviewing our weekly “Must Knows”!
Disclaimer: The risk of loss in stock, stock/options, futures, futures/options, and forex trading is substantial, and site visitors and subscribers should consider whether trading these markets ...
more

