
IBB Is Positioned For Outperformance
iShares Nasdaq Biotechnology ETF (IBB) has been moving in the right direction lately, mostly because the risk of an aggressive healthcare reform that could dramatically affect pricing power for biotech stocks has significantly declined in recent months.
Moving forward, the ETF still has a lot of room to recover in the years ahead, the fundamentals look strong at the portfolio level, and relative strength is a major return driver for iShares Nasdaq Biotechnology ETF.
A Major Catalyst For Biotech
Investors have been heavily concerned about the impact of regulatory risk on the healthcare sector and on biotech stocks, in particular, over recent years. More recently, Elizabeth Warren's healthcare reform proposals have exacerbated those fears. In the past several months, however, it looks like this uncertainty is dissipating.
The chart below shows the probabilities for different candidates in the Democratic presidential nomination as reflected by PredictIt. Warren has been considerably losing ground in recent months, with both Biden and Buttigieg rising. The fact that Michael Bloomberg announced his candidacy in the last week of November is also having an impact on the probabilities for different outcomes and how the market perceives the regulatory risk on biotech stocks.
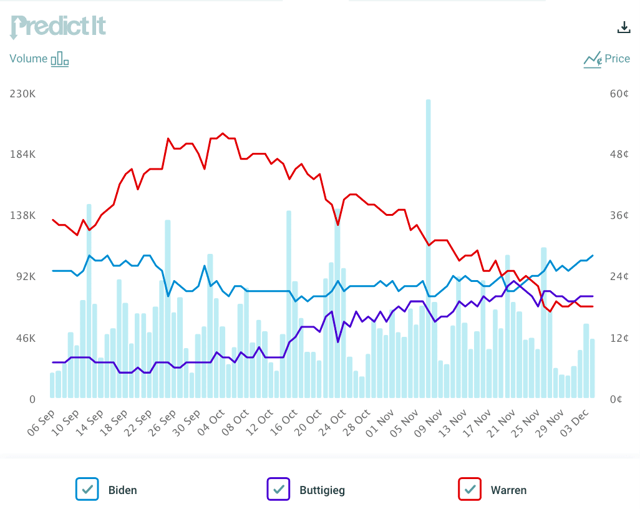
Source: PredictIt
The main point is that the chances for an aggressive reform of the healthcare system are clearly declining. Looking at the odds for different candidates, the balance of powers in the Congress and even the more moderate ideas for healthcare reform that are being proposed, the probabilities are that things won't be as dismal for biotech stocks as previously feared.
In this context, the iShares Nasdaq Biotechnology ETF has gained almost 19% in the past three months, and it's currently trading near its highs of the year above $120 per share.
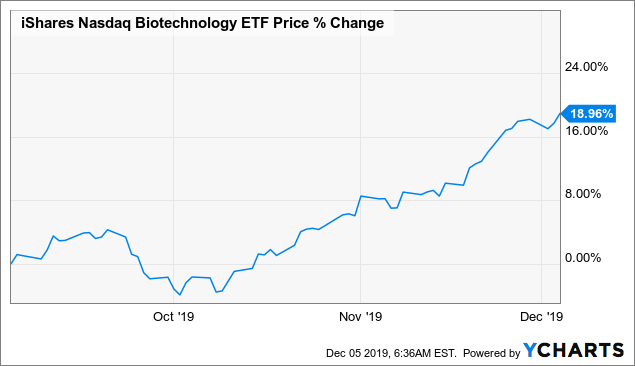
Data by YCharts
After such a strong gain, some kind of consolidation should come as no surprise at current levels. However, if we look at the broader picture, IBB is still trading below its highs from 2015.
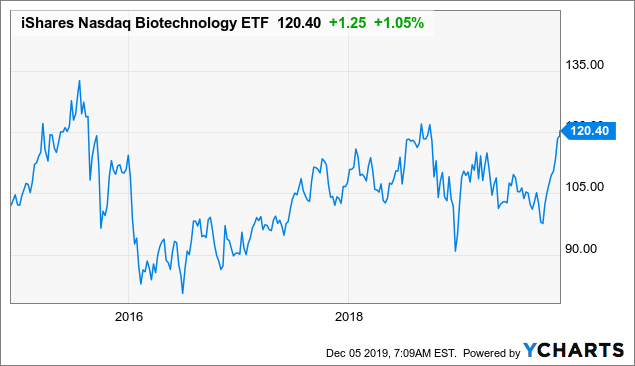
Data by YCharts
In other words, IBB has been stagnant in terms of price performance over the past four years, while earnings and cash flows from the companies in the portfolio have increased over time. Importantly, the stock market, in general, has produced big gains over this period, with IBB underperforming the SPDR S&P 500 (SPY) by a wide margin.
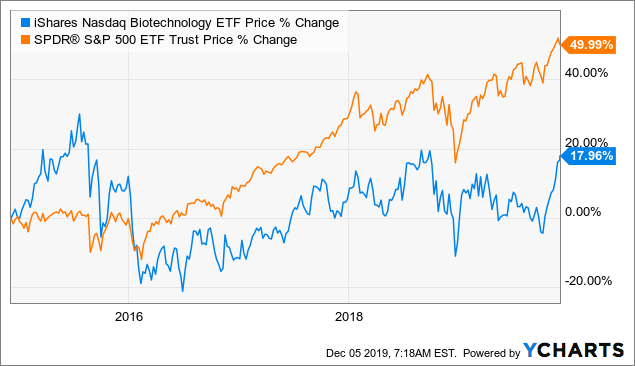
Data by YCharts
The political risk affecting biotech stocks has materially declined recently. The iShares Nasdaq Biotechnology ETF is starting to reflect this with vigorous returns in the past few months. Even if some kind of consolidation could be expected in the short term, we need to acknowledge that this short-term boost comes after several years of underperformance, and the ETF still has abundant potential to recover ground in the years ahead.
The Portfolio Looks Strong
Looking at the companies in the IBB portfolio, we can see that the largest 10 positions account for over 50% of assets. These names are Amgen (AMGN), Gilead (GILD), Vertex (VRTX), Illumina (ILMN), Biogen (BIIB), Regeneron (REGN), Alexion (ALXN), Seattle Genetics (SGEN), Incyte (INCY), and BioMarin Pharmaceutical (BMRN).
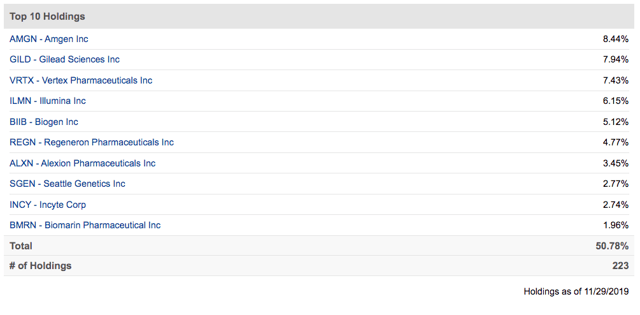
Source: Seeking Alpha Essential
In order to evaluate these companies from a quantitative multi-factor perspective, we can run them through the PowerFactors algorithm. This is a quantitative system that ranks stocks based on 4 factors: financial quality, value, fundamental momentum, and relative strength.
Here is a quick explanation of the factors considered in the algorithm:
- Financial quality includes profitability metrics such as return on assets, return on investment, return on equity, gross profit margin, operating profit margin, and free cash flow margin. The more profitable the business, the higher its ability to create profits for shareholders over the long term.
- Valuation covers typical valuation ratios such as price to earnings, price to earnings growth, price to free cash flow, and enterprise value to EBITDA. The cheaper the better, so stocks with lower valuation levels receive a higher ranking in the algorithm.
- Fundamental Momentum: This factor looks for companies that are performing better than expected and producing rising expectations, so it measures the change in earnings and sales forecasts. The bigger the increase in forecasts, the higher the score for the company in fundamental momentum.
- Relative Strength: Winners tend to keep on winning when a stock is outperforming the market, it tends to continue doing so more often than not over the middle term. For this reason, the PowerFactors system looks for stocks delivering above-average returns over different time frames.
The backtested performance numbers show that companies with high PowerFactors rankings tend to deliver superior returns in the long term. The higher the PowerFactors ranking, the higher the expected returns, indicating that the system is consistent and robust.
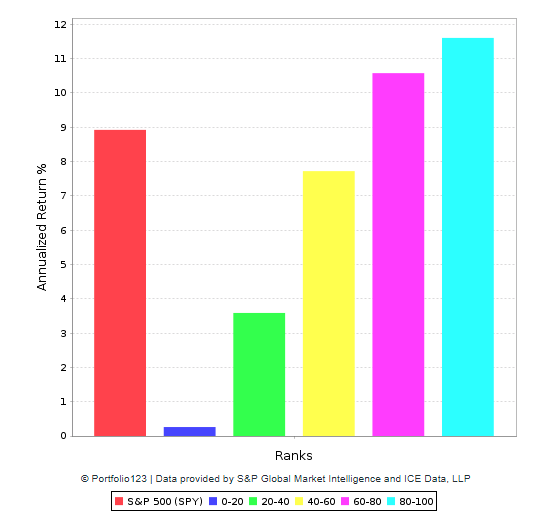
Data from S&P Global via Portfolio123
The table below shows the PowerFactors ranking for the top 10 positions in the IBB portfolio. All of these stocks have relatively high PowerFactors ranking, ranging from 78.5 to 99.9. The average value is also quite elevated at 92.9.
| Ticker | Name | PowerFactors | Quality | Value | F.M. | R.S. |
| INCY | Incyte Corp. | 99.9 | 99.6 | 99.7 | 98.0 | 85.9 |
| AMGN | Amgen Inc. | 99.9 | 98.7 | 99.1 | 95.9 | 88.5 |
| VRTX | Vertex Pharmaceuticals Inc. | 99.7 | 99.9 | 98.9 | 94.4 | 85.0 |
| BIIB | Biogen Inc. | 98.4 | 99.4 | 99.8 | 74.0 | 84.2 |
| REGN | Regeneron Pharmaceuticals Inc. | 98.0 | 98.9 | 99.7 | 85.9 | 68.3 |
| ALXN | Alexion Pharmaceuticals Inc. | 94.3 | 99.5 | 99.9 | 86.0 | 44.1 |
| ILMN | Illumina Inc. | 89.6 | 97.6 | 72.0 | 84.8 | 57.5 |
| GILD | Gilead Sciences Inc. | 87.9 | 94.8 | 99.7 | 61.9 | 50.3 |
| SGEN | Seattle Genetics Inc. | 82.4 | 82.5 | 46.1 | 68.2 | 93.5 |
| BMRN | BioMarin Pharmaceutical Inc. | 78.5 | 86.2 | 62.6 | 87.2 | 44.0 |
| Average | 92.9 |
Looking at the top positions in the iShares Nasdaq Biotechnology ETF, the fundamentals look clearly strong from a quantitative bottom-up perspective.
IBB Is On The Right Side Of Momentum
Momentum and relative strength can have a big impact on returns over the middle term. When a particular sector is outperforming, this tends to reinforce the bullish narrative around such a sector, with Wall Street analysts and the media usually adding more upside fuel to the fire.
Besides, relative strength is a major consideration for institutional investors. If you are trying to outperform the market while also managing massive amounts of money, then sector selection is one of the most important drivers of returns. Big money managers tend to gravitate towards the sectors that are outperforming in the middle term, which creates a self-sustaining cycle of momentum for the strongest sectors in the market.
In order to quantify the relative strength of different sectors, we can take a look at the Global Rotation strategy, which basically selects three ETFs among a wide variety of instruments based on risk and return over the past three to six months. In simple terms, the strategy buys the ETFs with the strongest risk-adjusted performance over the middle term.
The table below shows the backtested return numbers for the strategy since 2007, with the benchmark being 60% global stocks and 40% Treasuries. The numbers are quite strong in terms of both risk and reward.
Cumulative return is 341.9% for the Global Rotation strategy versus 107.1% for the benchmark, with annual returns amounting to 12.2% and 5.8% respectively. The maximum drawdown is -18.4% for the strategy versus -35.4% for the benchmark over the backtesting period.
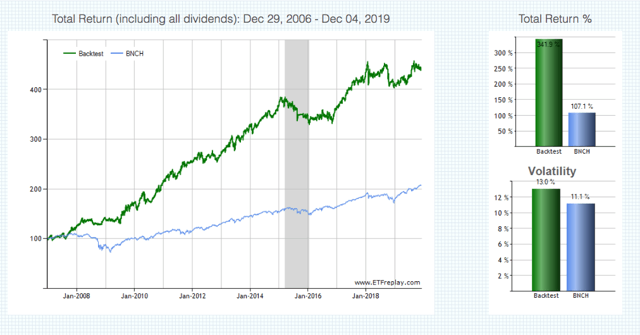
Source: ETFReplay
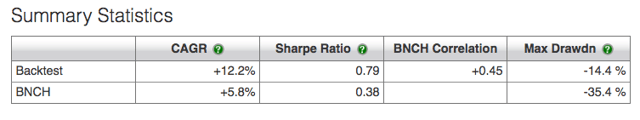
Source: ETFReplay
Factors such as momentum and relative strength produce attractive returns over long periods of time, but that doesn't mean that they will necessarily beat the benchmark in each and every year. The annual return numbers are quite illustrative in that respect.
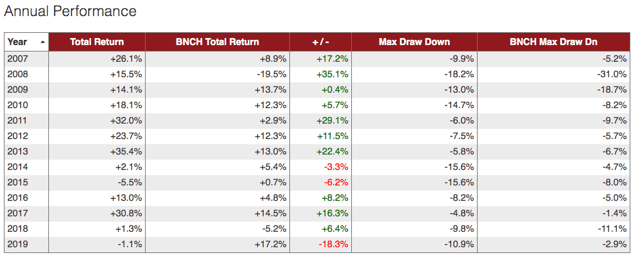
Source: ETFReplay
Without going too far, the Global Rotation strategy is significantly underperforming the benchmark in 2019. This is just the way these kinds of strategies work, no strategy can outperform in every year and under all kinds of market conditions.
In years when different asset classes and sectors are showing well-defined trends for long periods of time, a strategy that follows these trends will tend to deliver attractive returns. Conversely, when there is a lot of rotation between sectors and asset classes in the short term, the strategy will end up buying strength and selling weakness, which ultimately hurts performance.
That limitation being acknowledged, a strategy such as this one can be a valuable tool to evaluate the market environment and measure the main price trends across different sectors based on quantified data as opposed to subjectivities.
iShares Nasdaq Biotechnology ETF is now the strongest ETF in the group when looking at risk-adjusted relative strength over the middle term. If history is any valid guide for the future, this has bullish implications for the ETF going forward.
Disclaimer: I wrote this article myself, and it expresses my own opinions. I am not receiving compensation for it. I have no business relationship with any company whose stock is mentioned in ...
more

