
How To Find The Best Style Mutual Funds
Finding the best mutual funds is an increasingly difficult task in a world with so many to choose from.
You Cannot Trust Mutual Fund Labels
There are at least 915 different Large Cap Blend mutual funds and at least 6234 mutual funds across all styles. Do investors need that many choices? How different can the mutual funds be?
Those 915 Large Cap Blend mutual funds are very different. With anywhere from 16 to 2981 holdings, many of these Large Cap Blend mutual funds have drastically different portfolios, creating drastically different investment implications.
The same is true for the mutual funds in any other style, as each offers a very different mix of good and bad stocks. Some styles have lots of good stocks and offer quality funds. The opposite is true for some styles, while others lie in between these extremes with a fair mix of good and bad stocks. For example, the All Cap Value style, per my 3Q Style Rankings Report ranks fifth out of 12 styles when it comes to providing investors with quality mutual funds. Large Cap Blend ranks first. Small Cap Value ranks last. Details on the Best & Worst mutual funds in each style are here.
The bottom line is: mutual fund labels do not tell you the kind of stocks you are getting in any given mutual fund.
Paralysis By Analysis
I firmly believe mutual funds for a given style should not all be that different. I think the large number of Large Cap Blend (or any other) style of mutual funds hurts investors more than it helps because too many options can be paralyzing. It is simply not possible for the majority of investors to properly assess the quality of so many mutual funds. Analyzing mutual funds, done with the proper diligence, is far more difficult than analyzing stocks because it means analyzing all the stocks within each mutual fund. As stated above, that can be as many as 2981 stocks, and sometimes even more, for one mutual fund.
Any investor worth his salt recognizes that analyzing the holdings of a mutual fund is critical to finding the best mutual fund.
Figure 1: Best Style Mutual Funds
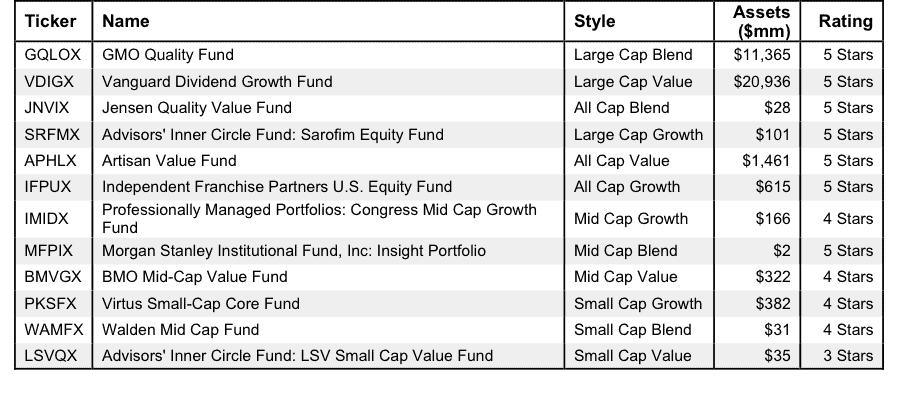
Sources: New Constructs, LLC and company filings
The Danger Within
Why do investors need to know the holdings of mutual funds before they buy? They need to know to be sure they do not buy a fund that might blow up. Buying a fund without analyzing its holdings is like buying a stock without analyzing its business and finances. As Barron’s says, investors should know the Danger Within. No matter how cheap, if it holds bad stocks, the mutual fund’s performance will be bad.
PERFORMANCE OF FUND’S HOLDINGS = PERFORMANCE OF FUND
Finding the Style Mutual Funds with the Best Holdings
Figure 1 shows my top rated mutual fund for each style. Importantly, my ratings on mutual funds are based primarily on my stock ratings of their holdings. My firm covers over 3000 stocks and is known for the due diligence we do for each stock we cover. Accordingly, our coverage of mutual funds leverages the diligence we do on each stock by rating mutual funds based on the aggregated ratings of the stocks each mutual fund holds.
Trust for Professional Managers: Jensen Quality Value Fund (JNVIX) is the top-rated All Cap Blend mutual fund and the first-ranked fund overall of the 6234 style mutual funds that I cover.
Sometimes, You Get What You Pay For
It is troubling to see one of the best style mutual funds, Jensen Quality Value Fund (JNVIX), have just $28 million in assets despite its Very Attractive or 5-star rating. On the other hand, Attractive rated BMO Mid-Cap Value Fund (BMVGX) has $322 million in assets. BMVGX has lower total annual costs than JNVIX (1.15%% and 1.48% respectively), but low costs cannot drive positive performance. Quality holdings are the ultimate driver of performance.
I cannot help but wonder if investors would leave BMVGX if they knew that it has a worse portfolio of stocks. It is cheaper than JNVIX, but, as previously stated, low fees cannot growth wealth; only good stocks can.
Sometimes, You DON’T Get What You Pay For
Morgan Stanley Insight Portfolio (MFPIX) is one of the smallest mutual funds in Figure 1, with just $2 million in assets. Sadly, other Mid Cap Blend mutual funds with more assets and inferior portfolios charge more than MFPIX. In other words, Mid Cap Blend mutual fund investors are paying extra fees for no reason.
Oppenheimer Main Street Mid Cap Fund (OPMSX) is one of the worst mutual funds in the Mid Cap Blend style. It gets my Dangerous rating based off the fact that less than 10% of its assets are allocated to Attractive-or-better rated stocks, while over 55% of its assets are allocated to Dangerous-or-worse stocks. OPMSX also has total annual costs of 3.96%, higher than MFPIX’s 1.28%. One would think that OPMSX would have fewer assets than MFPIX but instead it has over $1,657 million. Investors are paying extra fees for poor holdings.
The worst mutual fund in Figure 1 is Advisors’ Inner Circle Fund: LSV Small Cap Value Fund, which gets a Neutral (3-Star) rating. One would think mutual fund providers could do better for this style.
I recommend investors only buy mutual funds with more than $100 million in assets. You can find more liquid alternatives for the other funds on my mutual fund screener.
Covering All The Bases, Including Costs
My mutual fund rating also takes into account the total annual costs, which represents the all-in cost of being in the mutual fund. This analysis is complex for mutual funds, as one has to consider not only expense ratios, but also front-end load and transaction fees. A high front-end load not only costs investors at the beginning, it also reduces the growth investors can experience later on. While costs play a smaller role than holdings, my ratings penalize those mutual funds with abnormally high costs.
Top Stocks Make Up Top Mutual Funds
USANA Health Sciences, Inc. (USNA) is one of my favorite companies held by JNVIX. It earns my Very Attractive rating and is on the Most Attractive Stocks List for August. Over the last five years, UNSA has grown after-tax profit (NOPAT) by 17% compounded annually. The company earns an impressive return on invested capital (ROIC) of 47%, which places it in the top quintile of all companies I cover. USNA has also generated positive economic earnings in every year of my model, which goes back to 1998. Despite these metrics pointing to a high quality and growing company, UNSA is currently undervalued. At its current price of ~$70/share, UNSA has a price to economic book value (PEBV) ratio of 1.0, which implies that the market expects USNA to never meaningfully grow NOPAT for the remaining life of the company. This expectation seems likely to be surpassed given USNA’s track record of double-digit NOPAT growth and its high ROIC.
Disclosure: NewConstructs staff receive no compensation to write about any specific stock, sector, or theme.


