
How Much Slack In The Labor Force?
The chart below is probably the best depiction of the labor market because it includes hours worked, hourly pay growth, and the number of employed people.
Aggregate Income Proxy pic.twitter.com/YSF22PH6hm
— J. Brett Freeze, CFA (@Techs_Global) March 8, 2019
Effectively, it is weekly earnings multiplied by the number of workers in the labor force. As you can see, this growth reading fell from 4.32% in January to 3.24% in February. This expansion’s peak was in February 2015 when it hit 5.04%. That’s also when year over year private payrolls growth peaked at 2.56%. It fell from 2.2% to 1.9% in February. As you can tell, this aggregate income proxy is still near the high end of where it has been this cycle even though the February labor report wasn’t good.
People Are Starting To Look For Jobs
Usually, when more people start looking for jobs, it’s a bad sign because it means the labor market has turned lower. However, the chart below shows the economy is at a unique point where there has been an increase in people looking for work while the percentage of people who got a job isn’t falling.
There's been a substantial uptick in the number of people entering the labor force to look for jobs (i.e. entering as unemployed). That's a sign that the job market is drawing people in off the sidelines. pic.twitter.com/TGnnqrzTVm
— Ben Casselman (@bencasselman) March 8, 2019
The chart looks at the 3 month rolling average of monthly flows from outside the labor market. The increase in people coming off the sidelines and looking for work provides supply for the labor market. While this cycle hasn’t seen wage growth lead to inflation, which would cause the Fed to raise rates, potentially causing a recession, it’s still good for there to be slack in the labor market because it allows firms to expand. With slack, hiring isn’t limited by population growth.
Not Much Slack Left?
There has been an unusual activity with the unemployment rate which needs to be explained. The unemployment rate increased 0.1% in January to 4% even though 311,000 jobs were created which is a blockbuster report. That’s because the sequential difference in the seasonally adjusted employment rate isn’t equal to the number of jobs created/lost. In January, the number of employed people fell from 156,945,000 to 156,694,000. In the February report, only 20,000 jobs were added, but the unemployment rate fell from 4% to 3.8%. That’s because the number of employed people increased sharply to 156,949,000
The labor force participation rate is also worth reviewing because it helps measure slack in the labor market. The labor force participation rate increased 0.1% to 63.2% in January. That was important because it was the highest reading since September 2013. That increase occurred because the civilian population fell more than the labor force. The civilian non-institutional population over the age of 16 fell from 258,888,000 to 258,239,000.
(Click on image to enlarge)
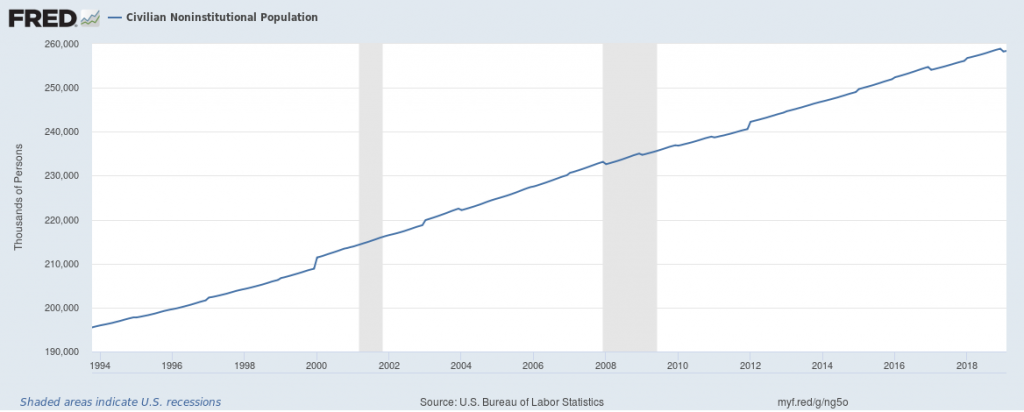
We aren’t sure why the population calculation fell sequentially, but we can tell you in this expansion the population fell 4 times and every time the decline happened in January. In February, the population increased normally as it was 258,392,000. The participation rate was steady in February.
The labor force is the divisor in the labor force participation rate and the divided in the unemployment rate calculation. The labor force has fallen in the past 2 months. Since the civilian population rose 153,000, while the labor force fell 45,000, we know people didn’t come off the sidelines and into the labor market in February. To be clear, the decline in the labor force wasn’t massive as it fell almost 400,000 in August 2018. However, it’s interesting now because the pool of available labor has been low and stable as you can see in the chart below.
the fall in the pool of available labor appears to have bottomed out. pic.twitter.com/EXTpfFPl1f
— econhedge (@econhedge) March 8, 2019
The pool is hovering where it bottomed last cycle and is above the 1990s cycle bottom. If there isn’t much labor available, there will be more wage growth and employment growth will be limited. The unemployment rate is in the process of bottoming. It might not have reached its trough, but it is close. The rate stabilizes with employment growth between 145,000 to 155,000.
Recession Not Coming Soon
Full employment doesn’t mean the economy is headed for a recession. The chart below does a great job of showing how declining yearly private payroll growth is in the full employment zone.
If full employment is defined as slower jobs growth & stronger wage growth, we may be approaching it today though the jury is still out, in our view. Either way, this does not imply recession is right around the corner. In recent cycles, "full employment" lasts for 18-24 months. pic.twitter.com/yIWoRlUwxt
— Renaissance Macro (@RenMacLLC) March 11, 2019
The full employment zone lasts for 18-24 months. Year over year employment growth hasn’t shown enough signs that it has peaked yet, but given the low unemployment rate, it could be close. The prime age participation rate suggests there’s still a bit more slack left in the labor market. Even if the growth rate has peaked, there probably won’t be a recession in 2019.
Retail Sales Improve
Retail sales growth was a disaster in December as the charts below show.
US #retail sales: encouraging +0.2% rebound in Jan:
— Gregory Daco (@GregDaco) March 11, 2019
- drag from #autos (-2.4%) & #gasoline (-2.0%)
- boost from rec stors (4.8%), building material (3.3%), online (2.6%) & restaurants/bars (0.7%)
- ex autos: 0.9%
- core sales 1.1% (after -2.3% in Dec)
--> core momentum +2.7% Y/Y pic.twitter.com/JewwaxN4bF
Those who thought the terrible result would be revised higher were disappointed as every figure was revised lower. Monthly headline sales were down 1.6% instead of 1.2%. Retail sales without autos were 2.1% instead of 1.8%. Without autos and gas, sales were down 1.6% instead of 1.4%. The control group had monthly sales growth of -2.3% instead of -1.7% which was originally reported.
Monthly results improved in January as the results in December made for very easy comps. However, yearly growth only improved modestly. Headline monthly sales growth was 0.2% which doubled estimates. Retail sales growth without autos was 0.9% which tripled estimates. Excluding autos and gas sales growth was 1.2% which doubled the consensus. Finally, sales from the control group were up 1.1% monthly which beat estimates for 0.7% growth.
Autos were weak as they fell 2.4%. They were also weak in February, so that’s a bad sign for the next report. Online sales were up 2.6% and gas sales fell 2%. Core sales were up 2.7% year over year. Headline yearly sales growth (seasonally adjusted) increased from 1.6% to 2.3%. Sales without motor vehicles and parts dealers (non-seasonally adjusted) were up 3.2% yearly; that’s up from just 0.3% growth. December had the worst reading since February 2013.
Conclusion
The amount of slack in the labor market varies depending on which metrics you follow. Economists have wrongly stated the labor market was at full unemployment for a few years because they didn’t think discouraged workers would come back to the labor market. They thought the unemployment rate would stay structurally high. The good news is even if the economy is at full employment, there probably won’t be a recession in the next few quarters. The retail sales report improved from January because the economy isn’t in a recession and real wage growth improved. The proxy for aggregate income growth was extremely strong in January.
Disclaimer: Please familiarize yourself with our full disclaimer here.


