
How Many More Rate Hikes?
There have been numerous housing reports which have missed estimates in the past few months. It’s a bad sign for the economy because housing is a leading indicator. The initial problem in housing has been catalyzed by a lack of affordability and rising interest rates. The problem may morph into being caused by a weak economy if the labor market weakens.
The good news is the October existing home sales report beat estimates for the first time in 7 months. This doesn’t mean the trend is changing, but at least it signals the housing market isn’t cratering yet. Existing home sales were 5.22 million which was up 1.4% month over month, but down 5.1% year over year. This shows how the sequential improvement couldn’t make up for the trend weakness. Single family homes and condos were up 0.9% and 5.3% monthly, but down 5.3% and 3.2% yearly.
Year over year prices were up 3.8%. Prices have been up on a year over year basis for 80 straight months. However, prices were down 0.3% month over month to $255,400. Since home affordability is a problem, a decline in price growth will bring out buyers if the labor market is strong. Supply fell 1.6% to 1.85 million. In relation to sales, supply fell from 4.4 months to 4.3 months.
Weakness In Leading Cities
Some of the cities which have outperformed in this cycle are starting to show weakness. This is similar to how the stock market leaders crater the hardest and the quickest after the stock market tops. In the current scenario, the FAANG stocks have underperformed. Of course, we still don’t know if the stock market has topped this cycle.
The charts below show the beginning signs of weakness in the Dallas, Denver, Seattle, and San Francisco housing markets.
(Click on image to enlarge)
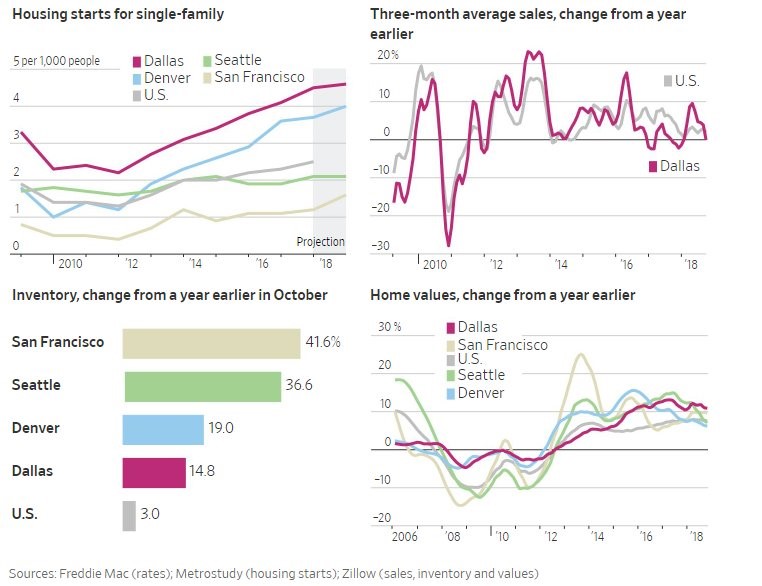
Source: Wall Street Journal
Since these areas have had high price appreciation, it’s likely that once they weaken, there will be a decent sized decline. Year over year, inventories in these cities are up much more than the national average as San Francisco has seen a whopping 41.6% increase. Home price growth has started to slow in these 4 cities. 3-month average sales in Dallas are at the flatline on a year over year basis.
Weak Durable Goods Orders
Sometimes the headline reading of the durable goods report isn’t in tune with the underlying trend which is what matters. In this case, volatile areas caused this report to look bad, but the underlying trend was also weak. Specifically, defense aircraft orders fell 59% month over month and civilian aircraft orders fell 21% and 19% in the past 2 months. Defense aircraft spending had risen by more than 100% in September. These volatile areas caused headline new orders to fall 4.4% monthly which missed estimates for a 2.5% decline.
However, excluding transportation, monthly growth was only 0.1% which missed estimates for 0.4%. Core capital goods orders didn’t grow which missed estimates for 0.3% growth. The chart below shows the economy is in a slowdown as year over year non-defense capital goods orders and shipments excluding aircraft were up 3.4% and 4.3%.
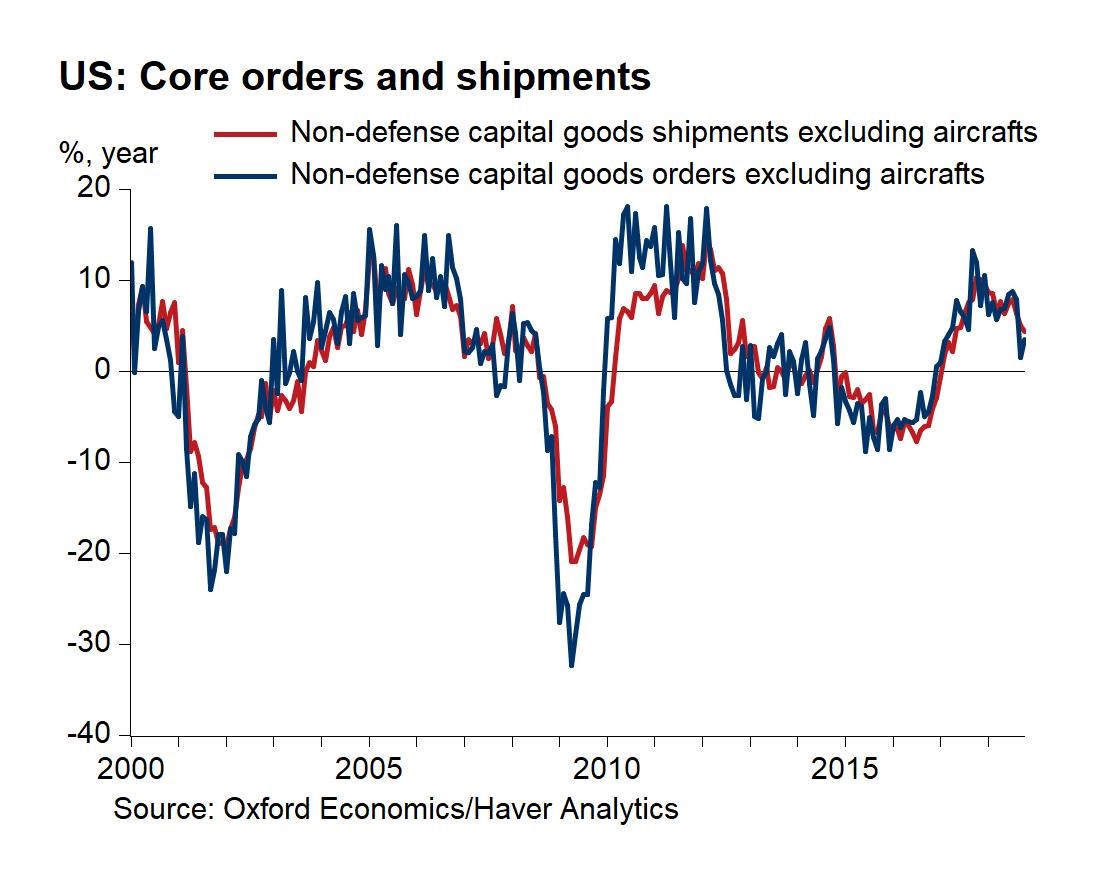
Source: Gregory Daco
This weakness implies the slow growth in non-residential business investment in Q3 will continue into Q4. Global growth is slowing, and the fiscal stimulus is losing its ability to boost business investment. Shipments are a direct input to GDP. Overall, this report pushed the NY Fed’s Nowcast for Q4 GDP growth down 4 basis points; the latest update has growth coming in at 2.51%. The tracking estimates will be much more reliable in December as more hard data will be released.
Futures Market Differs From Powell
Powell has been hawkish since becoming chair even though economic growth has slowed in the 2nd half of 2018 as evidenced by the October durable goods report we just reviewed. The Fed fund futures market combines the market’s expectation for the economy with Fed statements to predict rates. The Fed’s statements are believed in the short run, but not as much in the long run. The Fed fund futures market is on board with the December hike which the FOMC has guided for since there is a 79.2% chance of a hike. This is despite the volatility in stocks which shows Powell is less afraid of stock market volatility than his predecessors.
The Fed fund futures market disagrees with the 2019 Fed dot plot. As you can see from the chart below, the market only expects 2 more hikes this cycle.
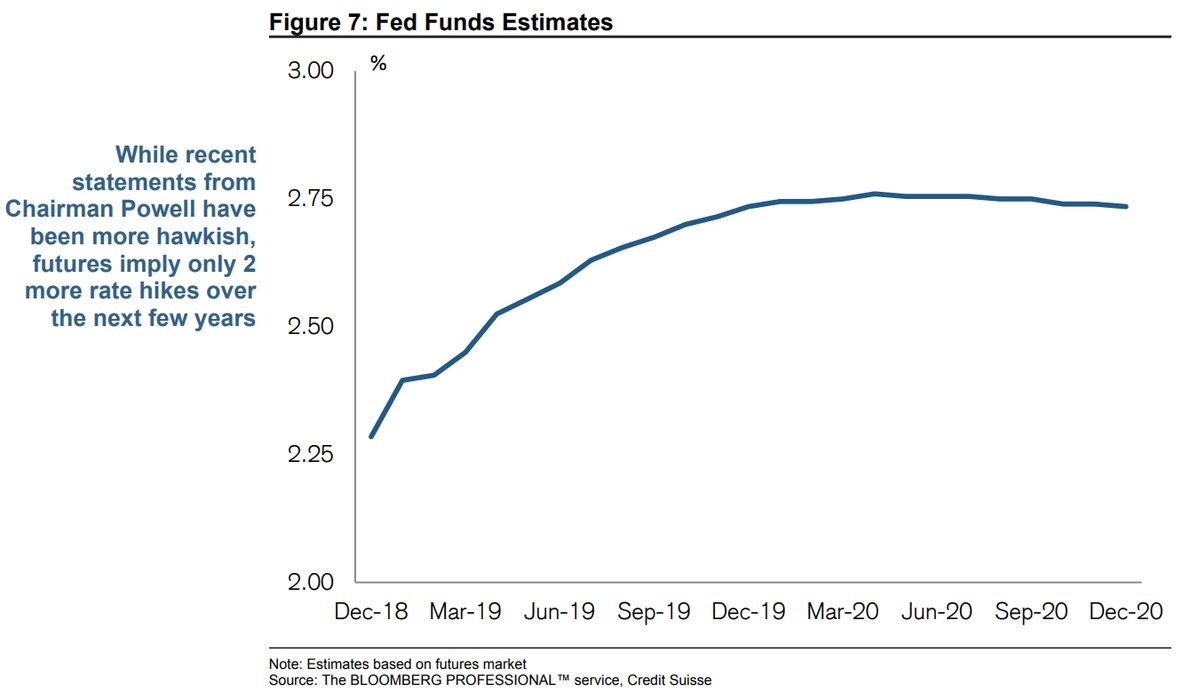
Source: Credit Suisse
The middle of the 2020 dot plot has the Fed funds rate between 3.25% and 3.5%. The Fed sees 2 to 3 more hikes than the market.
As you can see from the chart below, the Fed funds futures market has a bad track record of predicting intermediate term policy.
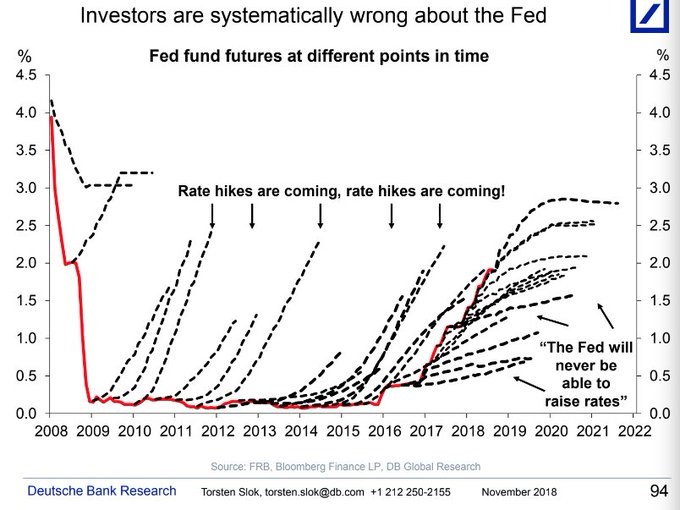
Source: Deutsche Bank
The futures market tells us what will probably happen at the next meeting, but after that, it can’t be trusted. It’s important to point out that predicting policy is the combination of predicting economic results and how the Fed will react to them. The Fed has been more hawkish than the futures market has expected recently. Since some of the future hikes aren’t priced in, if the Fed follows through on its dot plots, near-term bond yields will increase sharply. The Fed could easily invert the curve with these hikes into a slowdown. The latest difference between the 10-year yield and the 2-year yield is only 23 basis points.
Fed Making Its Mark
The first few rate hikes were interesting because financial conditions eased even though you’d expect rate hikes to tighten conditions. That’s because conditions were tight in early 2016 as the economy fell into a sharp slowdown which was almost a recession. Now the hikes are finally making their mark as the financial conditions index is getting tighter. The chart below shows how financial conditions are constricting; it gives us an idea of where policy is. Further rate hikes will be a drag on economic growth in 2019.
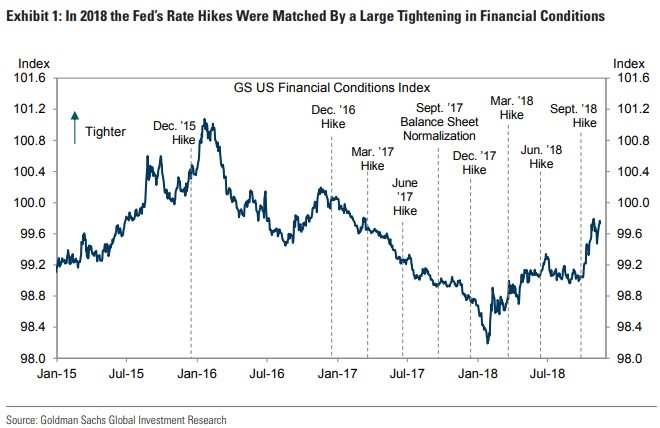
Source: Goldman Sachs
Conclusion
The housing market has been showing signs of weakness, but existing home sales beat estimates partially because prices fell. The October durable goods report was bad as core shipment growth has been slowing for a few months, making this look like 2012 and 2014. The Fed is hiking into this slowdown making it different than the last 2 slowdowns in this expansion. In the first slowdown, the Fed was doing QE and had zero percent interest rates. In the second slowdown, the Fed hiked once which was its first hike. Now the Fed is much deeper into its hike cycle and is unwinding its balance sheet. The hawkish Fed increases the odds that this slowdown turns into a recession.
Disclaimer: Please familiarize yourself with our full disclaimer here.


