
How Hedge Funds Are Positioned
Following futures positions of non-commercials are as of February 25, 2020.
10-year note: Currently net short 274k, down 32.2k.
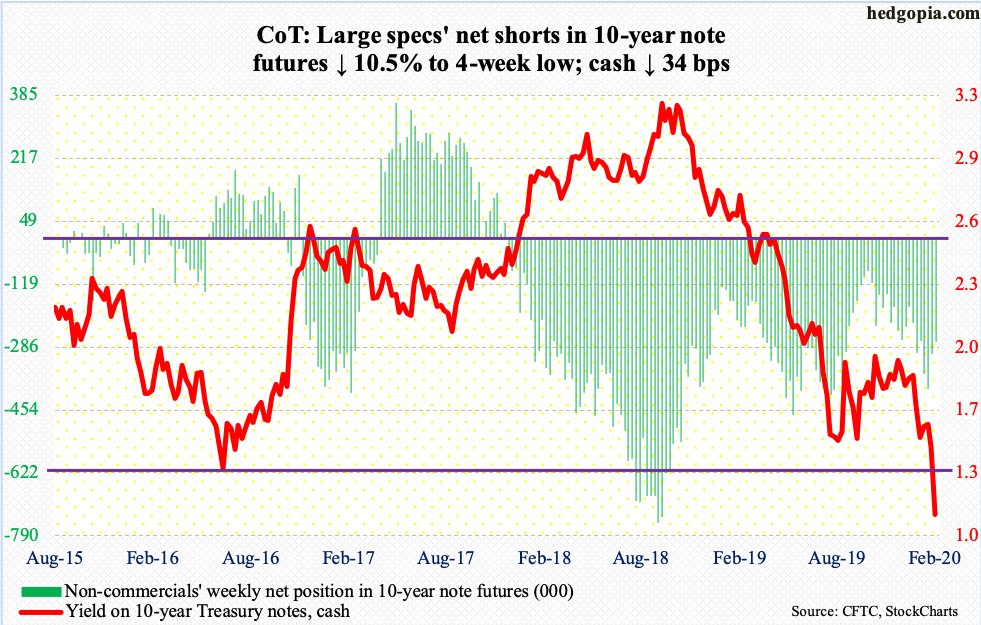
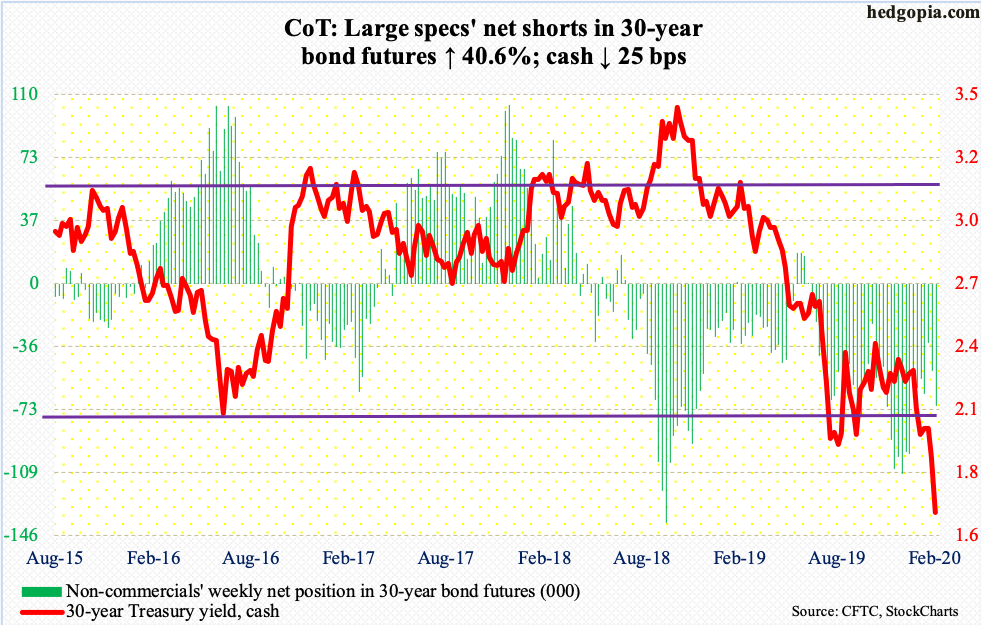
There it goes! The 10-year Treasury yield (1.13 percent) pierced through the lows from July 2012 and July 2016 – 1.39 percent and 1.34 percent, respectively. The 30-year yield already fell to a new low last week and made another low this week to end at 1.67 percent.
The long end of the Treasury yield curve is begging the Fed to jump into action. In the futures market, a 25-basis-point cut is baked in in next month’s meeting, slated for 17-18, with nearly half betting for a 50-basis-point move. By December, markets expect the benchmark rate to be a full percentage point lower!
The problem is, the fed funds rate is already at a range of 150 to 175 basis points. Six 25-basis-point cuts, and rates will be zero bound. Then what? Negative rates? The euro zone and Japan – and a few others – tried that, with not much to write home about. Corporate bonds? Once again, both the ECB and the BoJ tried that, and once again, the record speaks for itself. Equities? The BoJ does buy equity ETFs, and the less said the better about that. These banks already have bloated balance sheets. The point is, central banks are running out of ammunition. The reason why they are increasingly calling for aggressive fiscal spending in the first place.
In this environment, the thing to watch is not what new tools the Fed – or other major central banks – come up with, rather how equities react, or whether or not the initial positive reaction to central bank action will be lasting.
30-year bond: Currently net short 70.7k, up 20.4k.
Major economic releases next week are as follows.
The ISM manufacturing index (February) is published Monday. In January, manufacturing activity increased 3.1 points month-over-month to 50.9. This was the first 50-plus reading in six months.
Wednesday has on tap the non-manufacturing index (February). Services activity rose six-tenths of a point m/m to 55.5 in January – a five-month high.
Productivity (4Q19, revised) and durable goods orders (January, revised) are due out Thursday.
Preliminarily, non-farm output per hour rose at a seasonally adjusted annual rate of 1.4 percent in 4Q19.
In the 12 months to January, orders for non-defense capital goods ex-aircraft – proxy for business capex plans – rose 0.9 percent to $69.6 billion (SAAR). Orders peaked in July 2018 at $70 billion.
Employment (February) comes out Friday. The economy began the year with an addition of 225,000 non-farm jobs. Last year, the monthly addition averaged 175,000, down from 193,000 in 2018.
WTI crude oil: Currently net long 624.7k, up 20.1k.
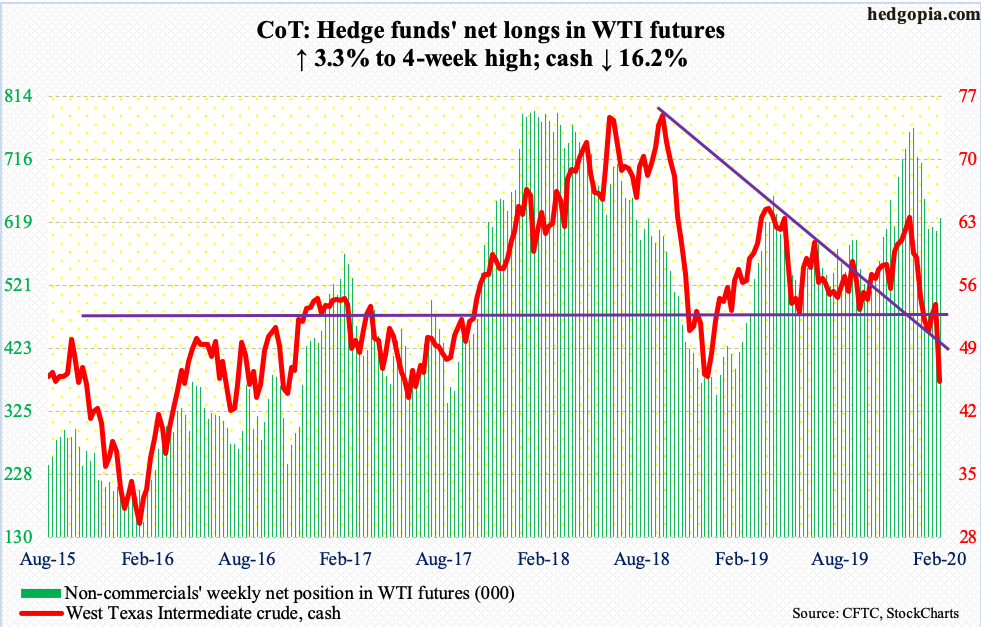
Thursday last week, a seven-session rally was stopped just before testing horizontal resistance at $55. Then, the cash ($44.76/barrel) came undone, dropping in each session this week and once again losing $50-51. Friday, it dipped to $43.85 intraday before seeing some bids. In December 2018, WTI made an intraday low of $42.36, which was a successful retest of $42.05 from June 2017. This level deserves watching.
The EIA report for the week of January 21 – out Wednesday – was not bad but did not matter amidst a flood of selling orders. US crude production remained unchanged at record 13 million barrels/day. Crude imports fell 330,000 b/d to 6.2 mb/d. Gasoline and distillate stocks dropped 2.7 million barrels and 2.1 million barrels to 256.4 million barrels and 138.5 million barrels, in that order. Crude stocks grew but only by 452,000 barrels, to 443.3 million barrels. Refinery utilization fell 1.5 percentage points to 87.9 percent.
E-mini S&P 500: Currently net long 55.6k, up 25.8k.
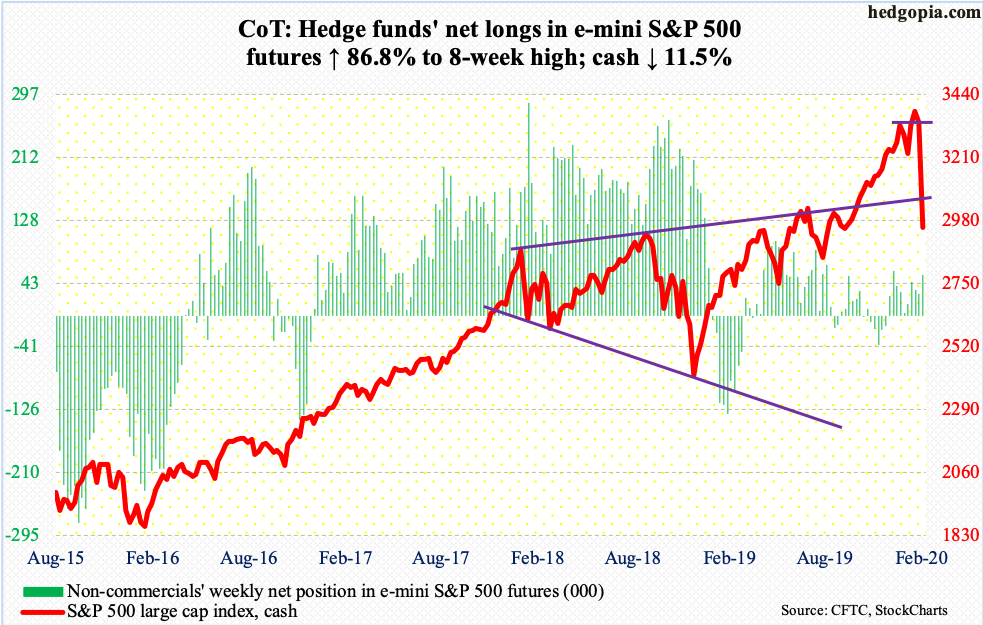
In a typical ‘stairs up, elevator down’ fashion, the cash lost just under 16 percent intraday in merely seven sessions. On Wednesday last week, it printed 3393.52 intraday. By Friday this week, it tagged 2855.84. Both the 50- and 200-day moving averages have been lost. The overly complacent attitude shown by the longs got quickly rerated – somewhat.
In the week to Wednesday, US-based equity funds lost $22.1 billion (courtesy of Lipper). In the same week, SPY (SPDR S&P 500 ETF), VOO (Vanguard S&P 500 ETF) and IVV (iShares Core S&P 500 ETF) together lost $12.7 billion (courtesy of ETF.com).
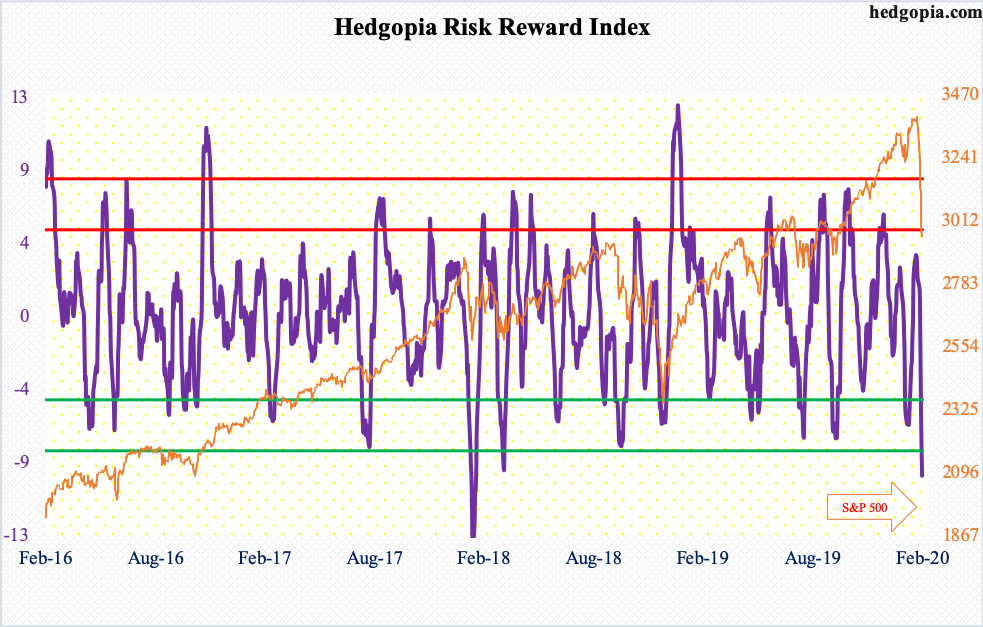
The rally last October began after the S&P 500 successfully tested important support north of 2800. On October 3, it bottomed at 2855.94 just above the 200-day. Friday’s intraday low was 2855.84, closing at 2954.22. Amidst the carnage, bulls showed the courage to step up in defense of this price point, with the session ending with a hammer reversal. A trading opportunity is possibly at hand. Some metrics are near washout levels. Merely 3.4 percent of S&P 500 stocks are above their 50-day. Our own Hedgopia Risk Reward Index has dropped well into the green zone (chart here).
The 200-day lies at 3047.17.
Euro: Currently net short 114k, up 22.5k.
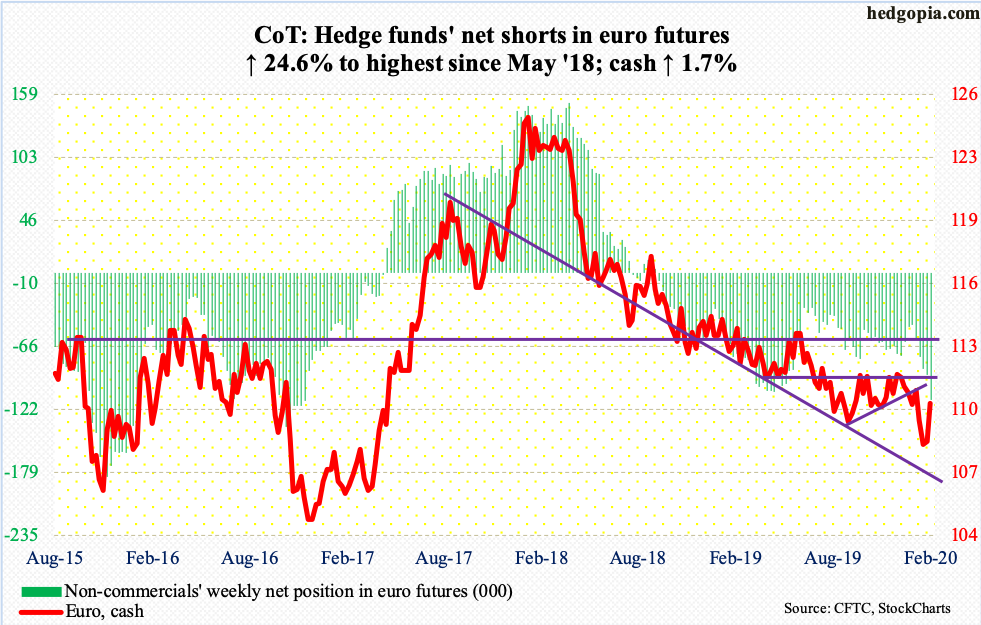
The intraday low of $107.82 from eight sessions ago held. In a week in which risk assets were sold left and right, the cash ($110.28) caught a bid. It rallied 1.7 percent for the week.
On December 31, the euro retreated after tagging $112.41 intraday. A falling trend line from that high gave way Thursday, as did horizontal resistance just south of $110. The weekly has room to head higher. That said, the weekly RSI, which has not crossed low 50s for nearly two years now, is worth watching, with Friday at 48.5. The 50-day at $110.34 is right above and the 200-day is at $111.04.
Gold: Currently net long 335.9k, down 17.8k.
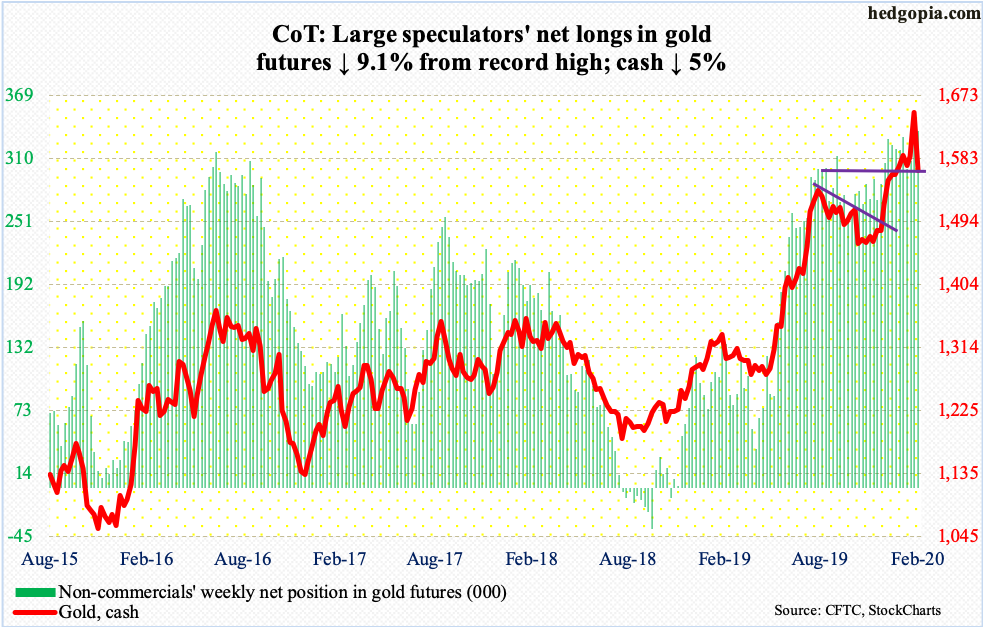
Money continued to flow into gold-focused ETFs, with IAU (iShares Gold Trust) gaining $80 million in the week to Wednesday and GLD (SPDR Gold ETF) $218 million (courtesy of ETF.com). In the prior five, GLD took in $2.7 billion.
The cash ($1,566.70/ounce), however, reversed this week, down five percent, with Friday alone losing 4.6 percent. This was a week in which equities took a hard beating and bonds rallied like crazy. One would think the metal would add to gains. As a matter of fact, gold did rally Monday to $1,691.70, but $1,700 proved tough.
Leading up to this, the metal did rally nearly 17 percent in three months. Friday’s action preceded some indecision candles this week. It closed out the week right at crucial support at $1,550s-60s. A breach – likely – should lead non-commercials to at least reduce their near-record net longs.
Nasdaq 100 index (mini): Currently net long 39.6k, up 21.2k.
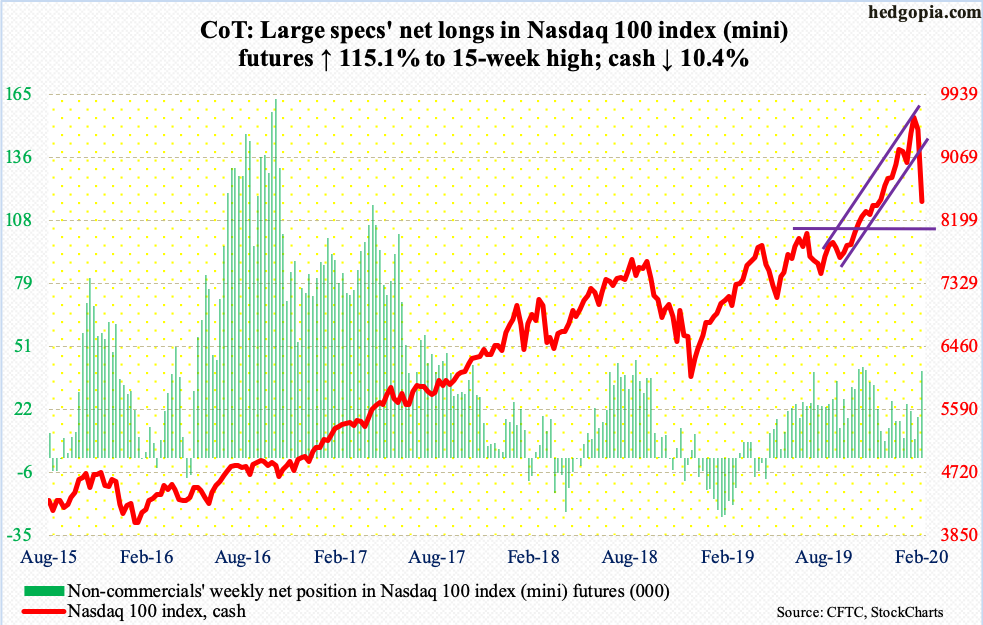
When conditions are euphoric, risk can happen fast, which it did this week. Until last week’s intraday all-time high of 9736.57, the cash (8461.83) relentlessly rallied – up 16 out of 20 weeks. From last October’s low, it jumped 30 percent! This week, it collapsed 10.4 percent and was down as much as 16.5 percent at Friday’s low.
Friday, bulls defended the 200-day, with the session eking out a gain of 0.3 percent. Bulls hope this week’s tape does not lead to outflows. At least until the week through Wednesday, that was not the case, with $603 million coming out of QQQ (Invesco QQQ Trust). In the prior four, it gained $3.6 billion (courtesy of ETF.com).
By the end of the week, only nine percent of Nasdaq 100 stocks were above their 50-day. This is severely oversold territory. In December 2018, the metric bottomed at three percent – a washout. A reflex rally is likely in the cards. If nothing else, Nasdaq shorts, after making a killing this week, could be tempted to lock in gains, helping push up the price. Mid-February, Nasdaq short interest was nine billion shares; mid-January’s 9.3 billion was the highest since October 2015.
Russell 2000 mini-index: Currently net long 48.2k, up 7.3k.
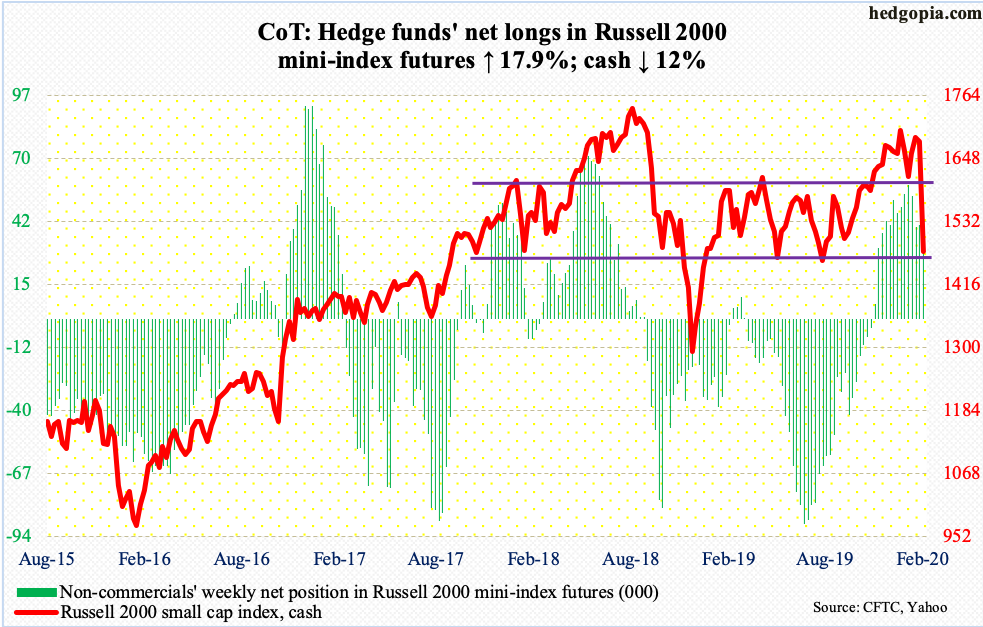
The cash (1476.43) sliced through both the 50- and 200-day this week, past crucial support just north of 1600, which goes back to January 2018.
Several times last year, including early October, small-cap bulls defended 1450s. It is a make-or-break. A loss of this level can potentially accelerate flows out of both IWM (iShares Russell 2000 ETF) and IJR (iShares Core S&P Small-Cap ETF). In the week to Wednesday, the former gained $27 million, while the latter saw no activity (courtesy of ETF.com).
Friday, the Russell 2000 made an intraday low of 1448.21, before bids showed up. A relief rally is the path of least resistance.
US Dollar Index: Currently net long 25.1k, up 849.
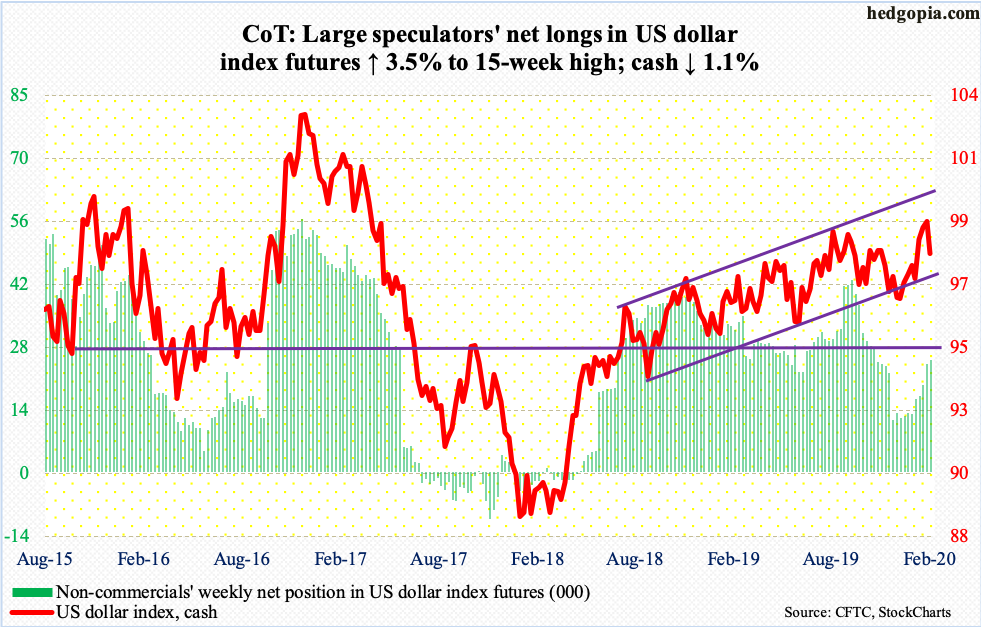
Last week’s weekly shooting star proved costly. This week, the cash (98.08) shed 1.1 percent, with room for continued unwinding of overbought condition. Last week’s high just about kissed channel resistance from August 2018. The lower bound lies at 96.50s. Before this, there is support at 97.50s, which is where the 50- and 200-day rest – respectively at 97.72 and 97.62.
VIX: Currently net short 77.6k, down 52.6k.
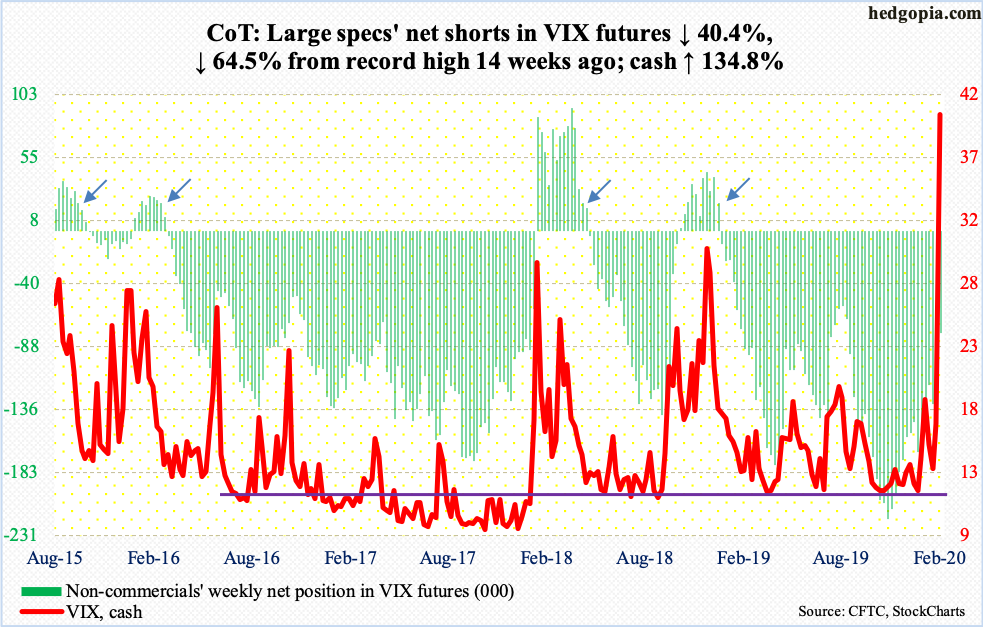
In February, the cash (40.11) more than doubled. For the first time since November 2008, the monthly RSI crossed 70. That should tell us the momentum behind this week’s surge in VIX, which jumped 23 points this week – a two-year high. In February 2018, the volatility index surged to 50.30, before reversing hard. Friday, it jumped to 49.48 before pulling back. In all probability, it is a spike reversal, which raises the odds that VIX will head lower to unwind the overbought condition it is in.
As of Tuesday, non-commercials reduced net shorts by 52,618 contracts. They still hold 77,611 contracts. It is possible they cut back further on Wednesday through Friday as the cash surged. Several times in the past, the cash only peaked once these traders either went net long or substantially reduced their net shorts.


